
You have built this amazing React application with lots of components and everything works smooth but somehow, it feels slugish at certain places. You got that nice lazy loading that the stakeholder wanted but it slows everything down over time.
Now, how would you go ahead and improve this? Let’s have a look at profiling a React application!
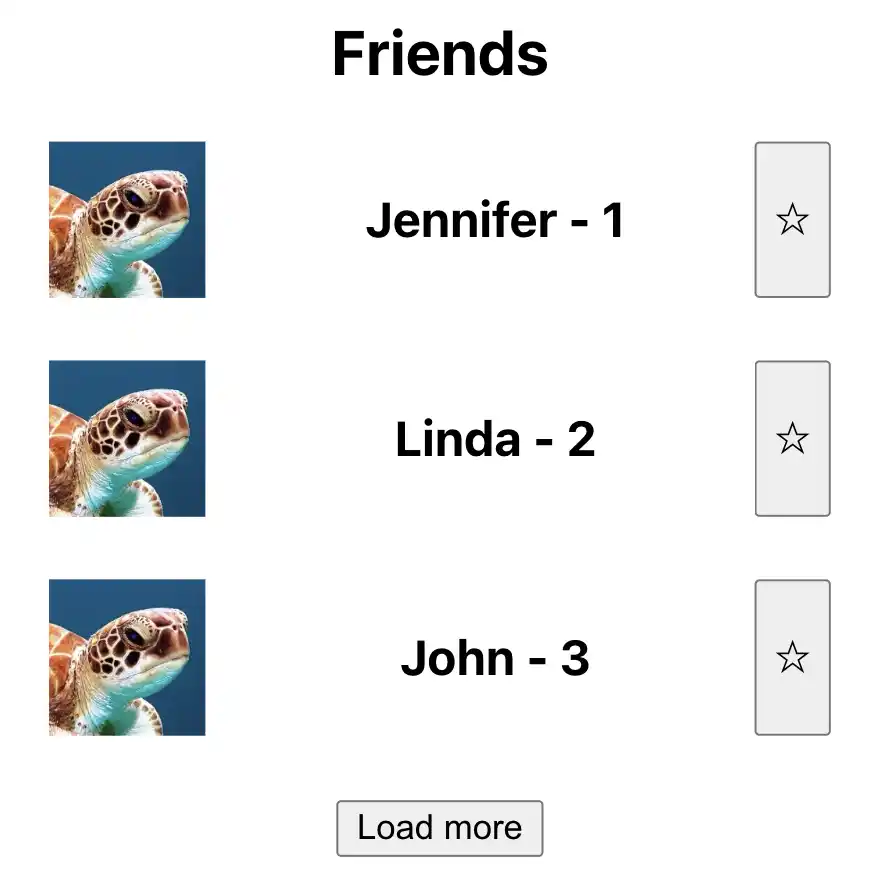
Your customer has been bothering you for weeks about his project TortoiseBook, and it is nearly finished, but, the most recent complaint was about performance issues! It seems like the site is getting slower the more friends are loaded in the list!
Profiler setup #
Now, how would you go about analyzing where the performance is lost? One way to do that would be with the usage of the React Developer tools . The React Developer tools in the Chrome browser have a profiler which can help you analyze what component renders during each action. Further on, there is a hidden option which lets you know WHY a component has rendered! How convenient, right?
Let me show you!
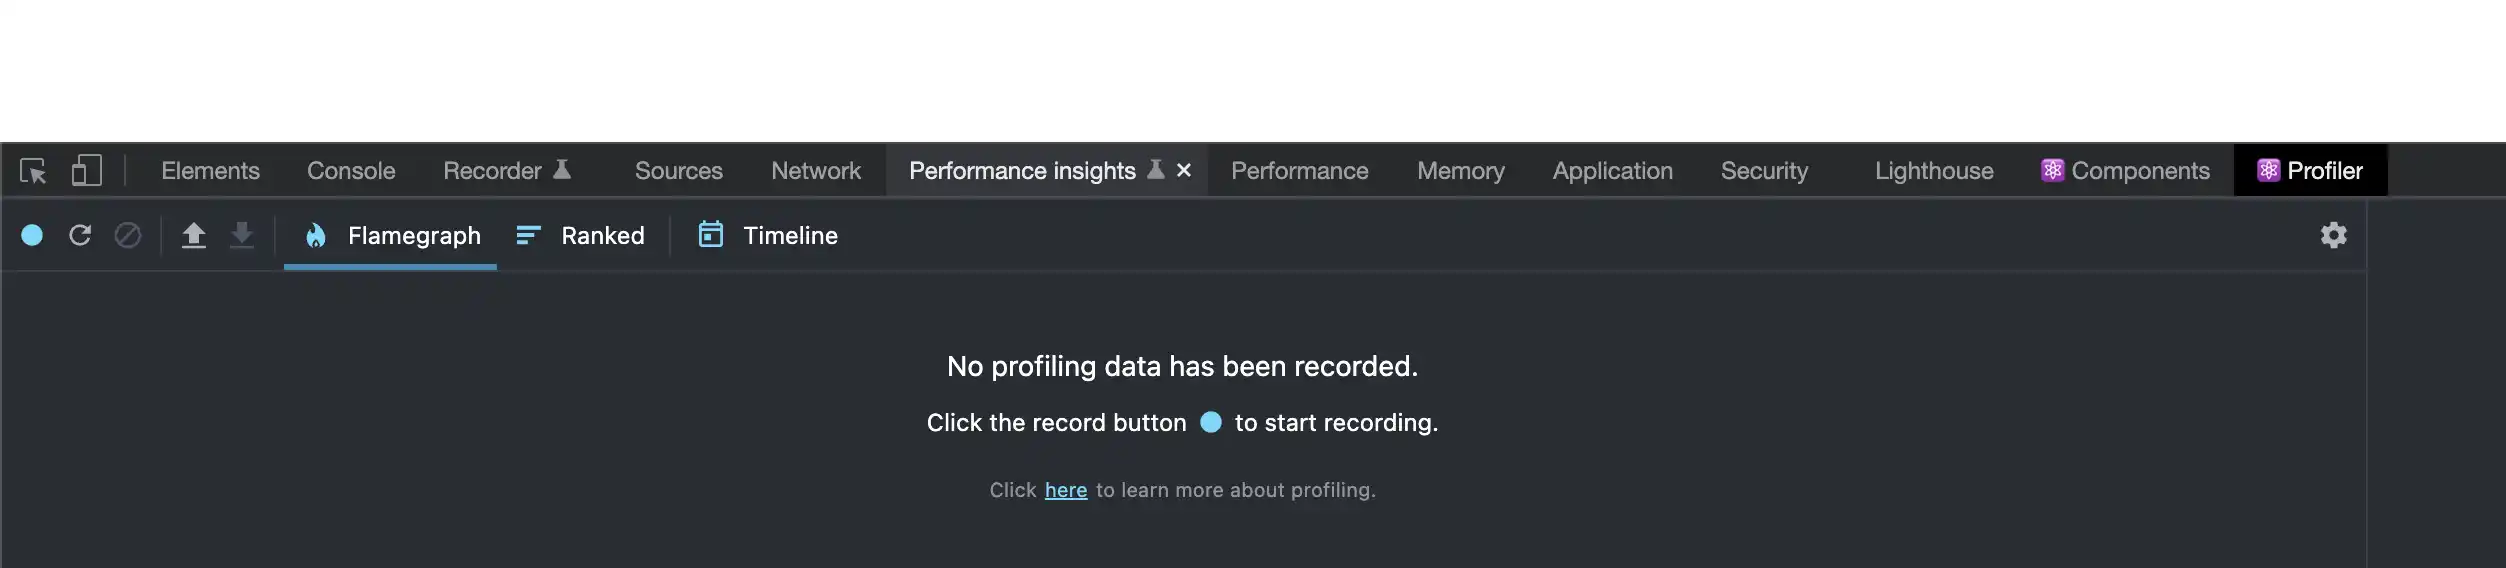
At first, open your browser developer tools and then open up the React Profiler.
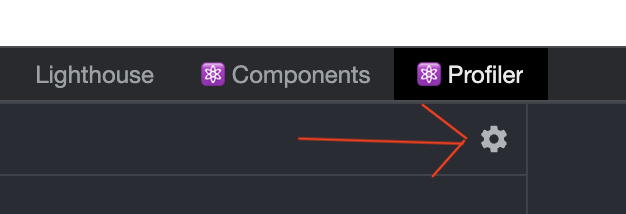
Then click the little settings gear on the right!
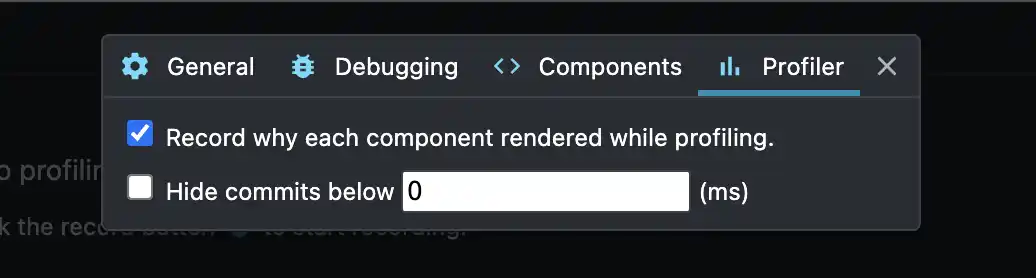
And configure “Record why each component rendered while profiling”
Now, we just need to profile the application and execute the action which causes performance issues.
So, back to TortoiseBook with our new gained knowledge and let’s analyze it!
Profiler in action #
Last time, the customer told you, the more tortoises are loaded, the slower it gets. So, lets turn on the profiler and load some more tortoises!
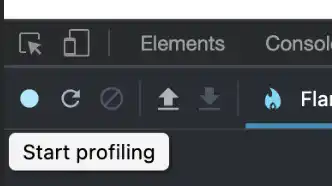
Click on the blue round button on the left to start the profiler.
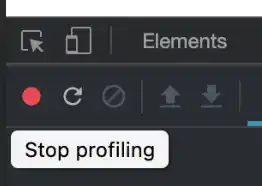
Execute the action in question and stop the recording by clicking on the appearing round red button!
This should give you a similar screen with a flame-graph of all components in your render tree.
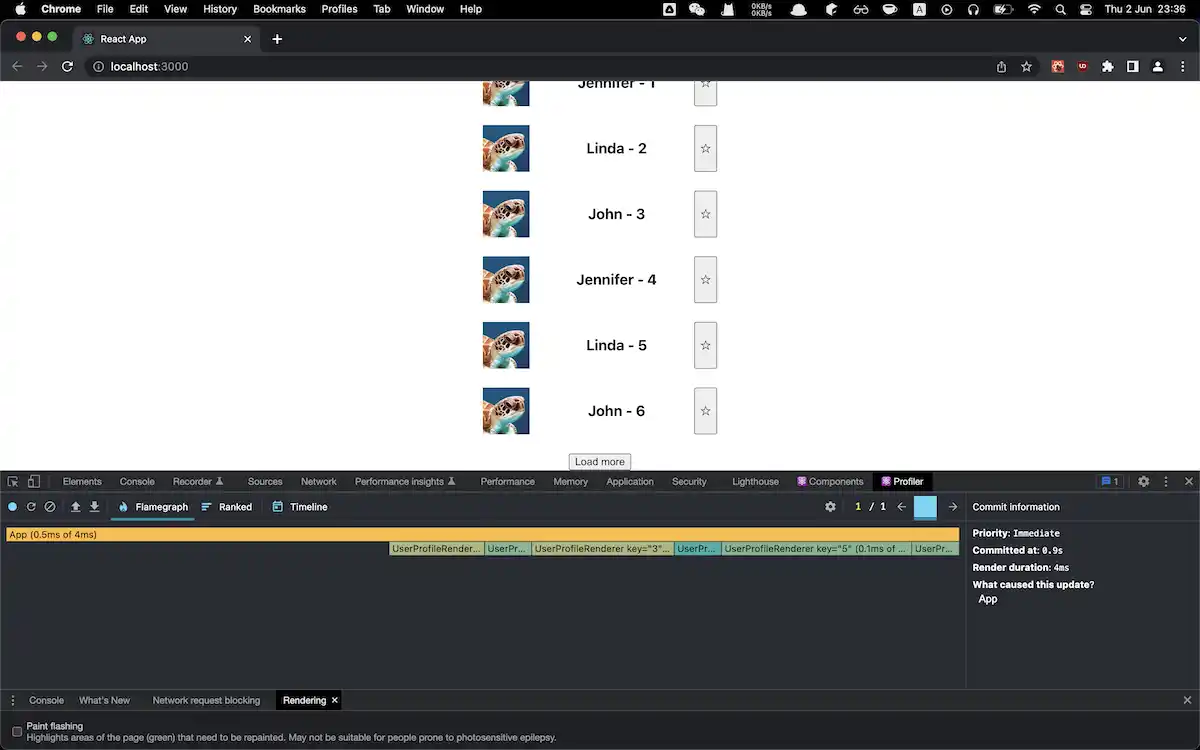
Profile result #
According to the results, all 6 user profile components have been rendered, even though the first three should not rerender. This already indicates there is something afoul. Every time the list changes, all components are being re-rendered. This is not good!
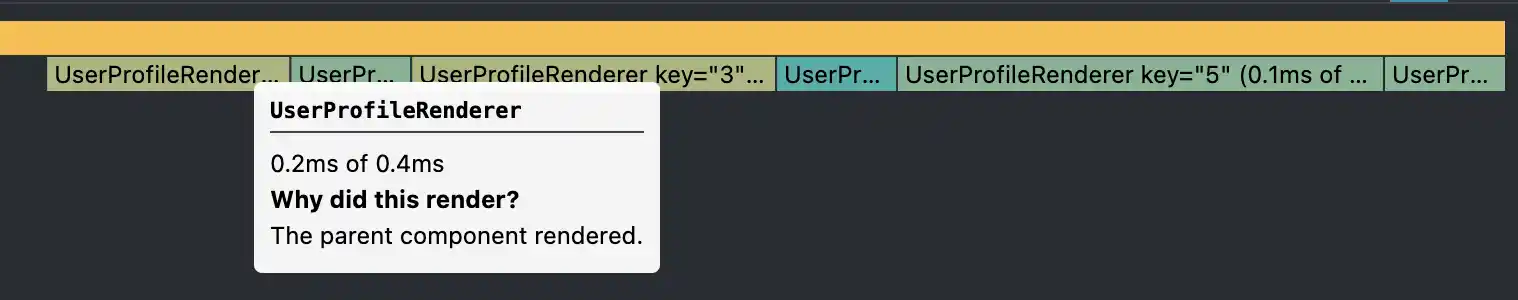
But, luckily, with hovering over the component bars, we can see why the component was re-rendered. In this case, the parent component experienced a change, namely more tortoises were added. So, how can you prevent the component from being re-rendered? Let’s have a look at the source of the user profile component.
export function UserProfileRenderer(props) {
    const toggleFavorite = () => props.setFavorite(oldVal => ({
        ...oldVal,
        [props.id]: !Boolean(oldVal[props.id])
    }))

    return <div className={"UserProfile"}>
        <img className={"ProfileImage"} src={props.image}/>
        <h3>{props.name} - {props.id}</h3>
        <button onClick={toggleFavorite}>
            {props.favorite ? <span>🌟</span> :
                <span style={{width: 20, height: 20}}>☆</span>}</button>
    </div>
};


export const UserProfile = UserProfileRenderer
Given the fact that no property has actually changed, you could just wrap the component with React.memo. This would keep the component from being re-rendered, as long as no parameters change.
import {memo} from "react";

export function UserProfileRenderer(props) {
    const toggleFavorite = () => props.setFavorite(oldVal => ({
        ...oldVal,
        [props.id]: !Boolean(oldVal[props.id])
    }))

    return <div className={"UserProfile"}>
        <img className={"ProfileImage"} src={props.image}/>
        <h3>{props.name} - {props.id}</h3>
        <button onClick={toggleFavorite}>
            {props.favorite ? <span>🌟</span> :
                <span style={{width: 20, height: 20}}>☆</span>}</button>
    </div>
};


export const UserProfile = memo(UserProfileRenderer)
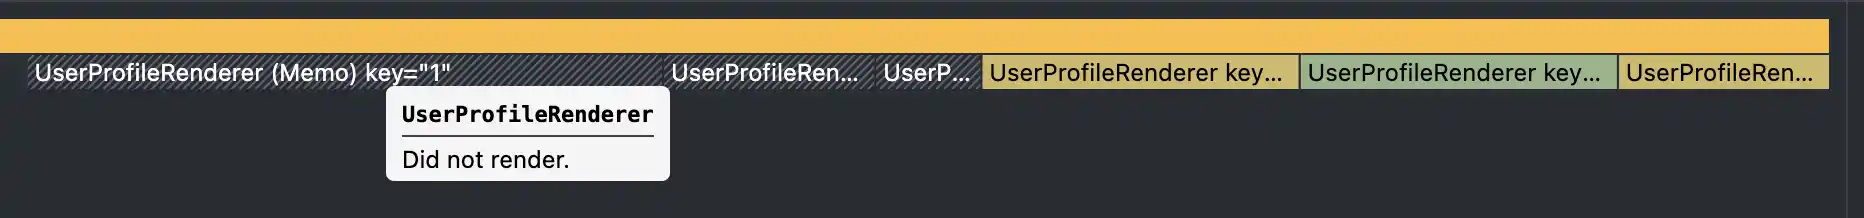
If we now run the profiler again, we are seeing now that the first three components are not being re-rendered!
I hope this knowledge will help you leave your customer happy with the new fixed TortoiseBook!
For more information on React.memo() or the hook variant React.useMemo() , check out the official documentation !
The source code for this project is available on GitHub .