
Introduction #
Did you ever ask yourself one of these questions?
- What tool can I use for unified log management across my entire application stack?
- How do I track the performance of individual functions in a microservices architecture?
- What’s the best way to collect metrics from different parts of a distributed system?
- Is there a standard solution for observing system behavior in cloud-native environments?
- Which open-source framework can help me in correlating logs, metrics, and traces from various sources?
- How can I come up with a Service Level Indicator (SLI)?
If so, OpenTelemetry might be the right thing for you! Let me introduce you into the world of OpenTelemetry and how it can help you in your daily work as a developer. But before, let’s clarify what observability is.
What is Observability? #
In the world of software engineering and IT operations, observability is a term that encapsulates the practice of tracking and understanding the state of systems. It’s about making the entire system transparent and understandable, from the high-level architecture down to the individual transactions and operations. Observability extends beyond mere monitoring; it encompasses a holistic view of the system’s health, performance, and behavior.
Imagine driving a car with a covered dashboard. Without visibility into speed, fuel level, or engine temperature, you’re driving blind. Observability in software engineering is like having a clear dashboard: it gives you vital insights into your application’s performance and health, enabling you to make informed decisions and avoid breakdowns.
Now, how would one go about implementing this? Well, this is where OpenTelemetry comes in.
What is OpenTelemetry? #
In the dynamic world of software development, understanding the performance and health of applications is crucial. This is where OpenTelemetry, an open-source project, comes into play. It’s a toolkit designed for capturing and exporting telemetry data like metrics, logs, and traces from your applications.
OpenTelemetry, emerging from the merger of OpenTracing and OpenCensus projects, represents a collaborative effort under the Cloud Native Computing Foundation. Its development reflects a broader industry trend towards open-source, vendor-neutral tools for application monitoring, making it a future-proof choice for developers.
Core Features of OpenTelemetry #
-
Tracing: Tracks the journey of requests through your system, identifying bottlenecks and latency issues.
-
Metrics: Gathers numerical data about your application’s operation, such as request counts and response times.
-
Logs: Records events, providing context and details about operations within your application.
The Importance of OpenTelemetry #
- Vendor-Neutral: It supports a wide range of platforms and languages, ensuring flexibility.
- Standardization: Provides a unified way to collect and export telemetry data, simplifying monitoring and analysis.
- Community-Driven: Benefits from the contributions of a vibrant open-source community, ensuring continuous improvement and relevance.
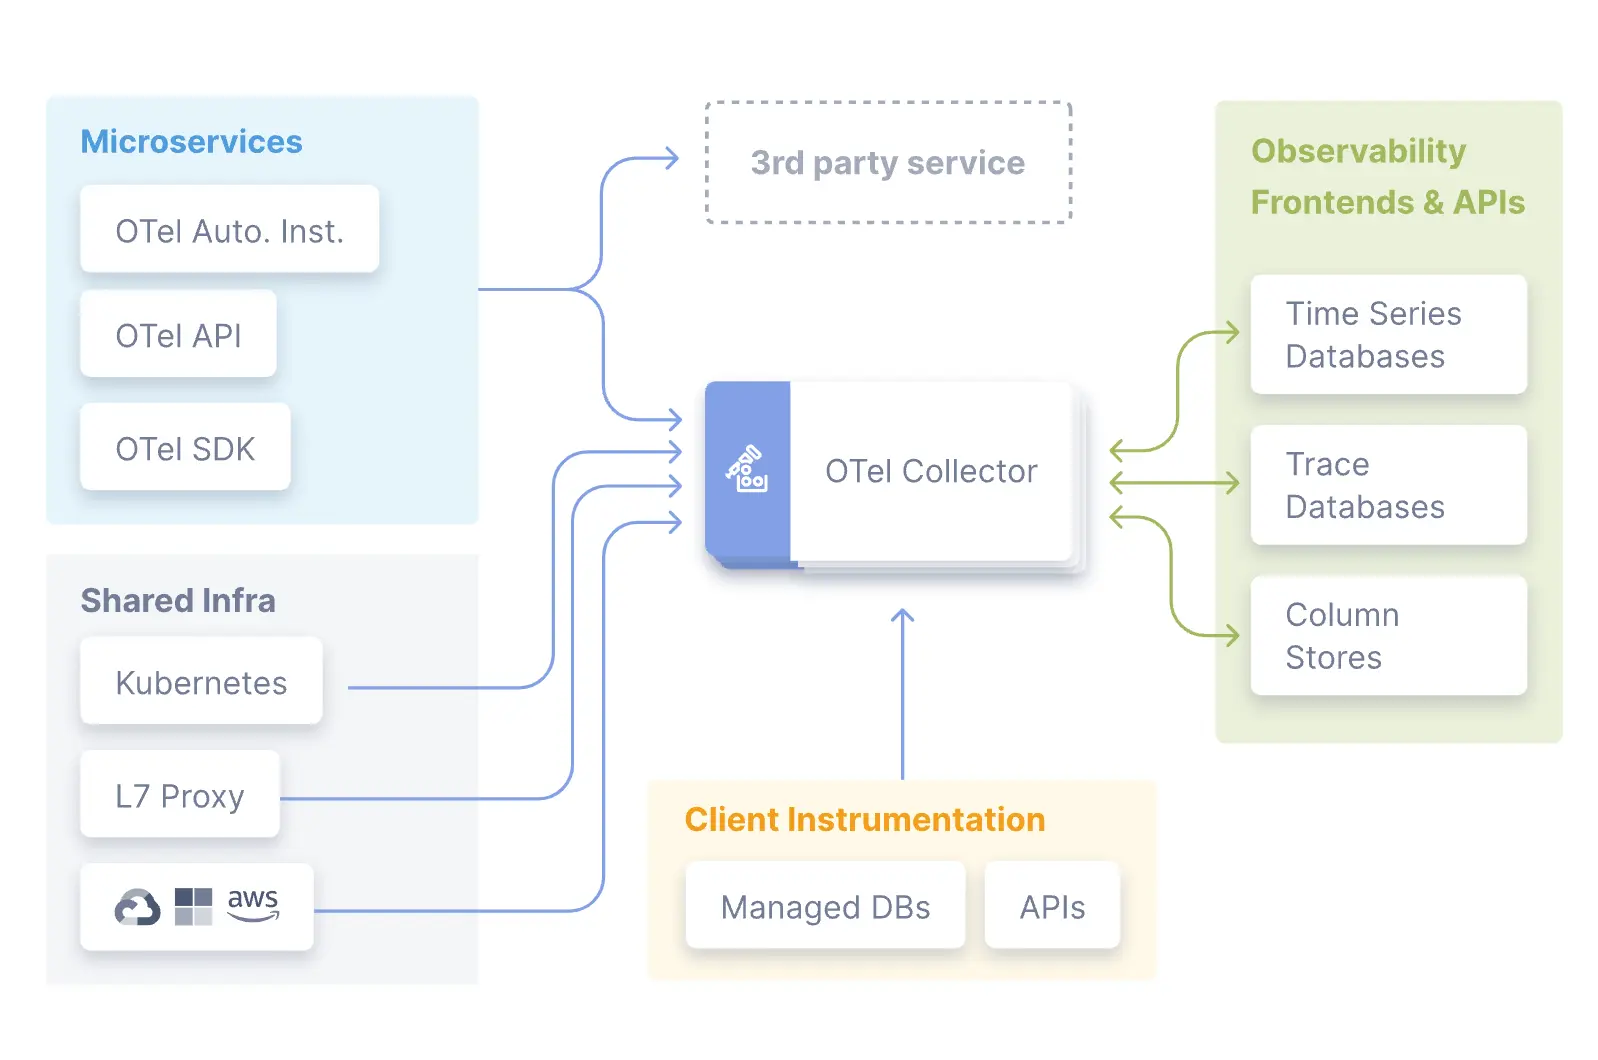
OpenTelemetry Components #
OpenTelemetry contains several components that improve the developer experience and simplify the collection and export of telemetry data. These components include:
- SDK: The SDK is a set of libraries that provide the core functionality of OpenTelemetry. It includes APIs for creating spans, recording metrics, and logging events. The SDK also contains exporters that send telemetry data to various backends, such as Prometheus, Jaeger, and Uptrace.
- Instrumentation Libraries: These libraries provide out-of-the-box instrumentation for popular frameworks and libraries, such as Spring Boot and Django. They automatically capture telemetry data from these applications, reducing the need for manual instrumentation.
- Collector: The collector is a service that receives telemetry data from applications and forwards it to the configured backends. It supports a wide range of protocols, including HTTP, gRPC, and Kafka.
- OpenTelemetry Protocol: The OpenTelemetry Protocol (OTLP) is a specification for transmitting telemetry data between applications and backends. It defines a set of data formats and transport protocols that can be used to send telemetry data.
Uptrace #
OpenTelemetry is just the first step in the observability journey, as is it only collects data. That data need to be exported to an application performance monitoring (APM) tool, which will help you in analyzing the data.
One of these tools is Uptrace , which is a vendor-neutral APM tool that supports OpenTelemetry. It provides a unified view of your application’s performance and health, allowing you to quickly identify and resolve issues.
Unlike many APM tools that lock you into a specific vendor, Uptrace stands out with its vendor-neutral approach. It allows seamless integration with various systems and languages, making it an adaptable choice in a multi-tech-stack environment. Its user-friendly interface and robust data correlation capabilities further set it apart, offering an intuitive and comprehensive monitoring experience.
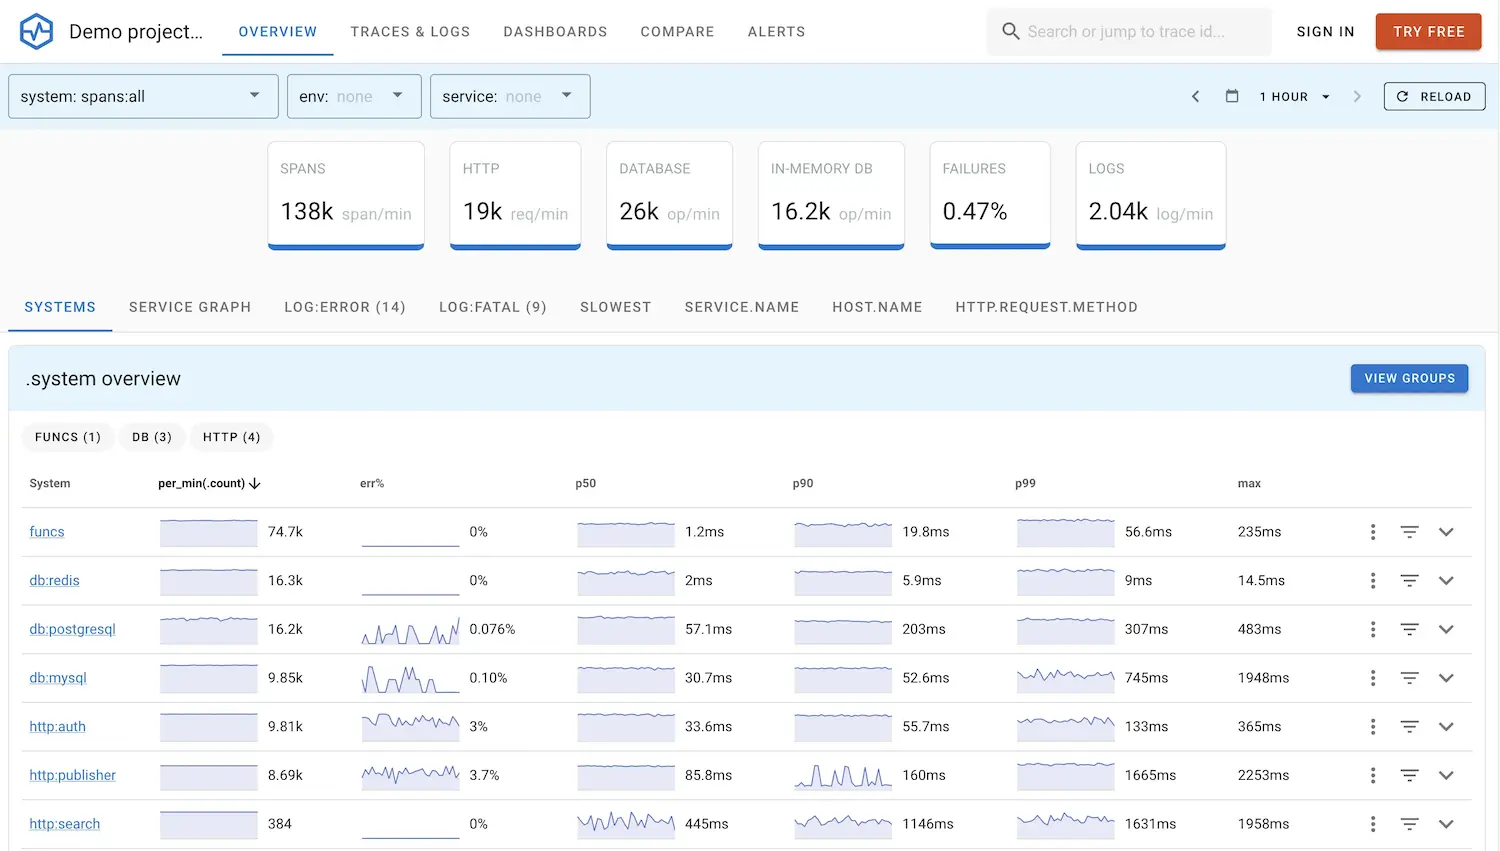
It can show you traces (spans), logs and metrics. The nice thing here is that you can correlate all of them together. This is especially useful when you are debugging a problem. You can see the logs, metrics and traces of a specific request in one place.
Further on, it offers rate, error, and duration metrics (RED) and latency percentiles p50/p90/p99/max for grouped elements like systems and traces.
Uptrace Example Trace #
Here is a demo of how to use Uptrace. You can see the traces, logs and metrics of your application in one place. You can check it out by yourself here https://app.uptrace.dev/play
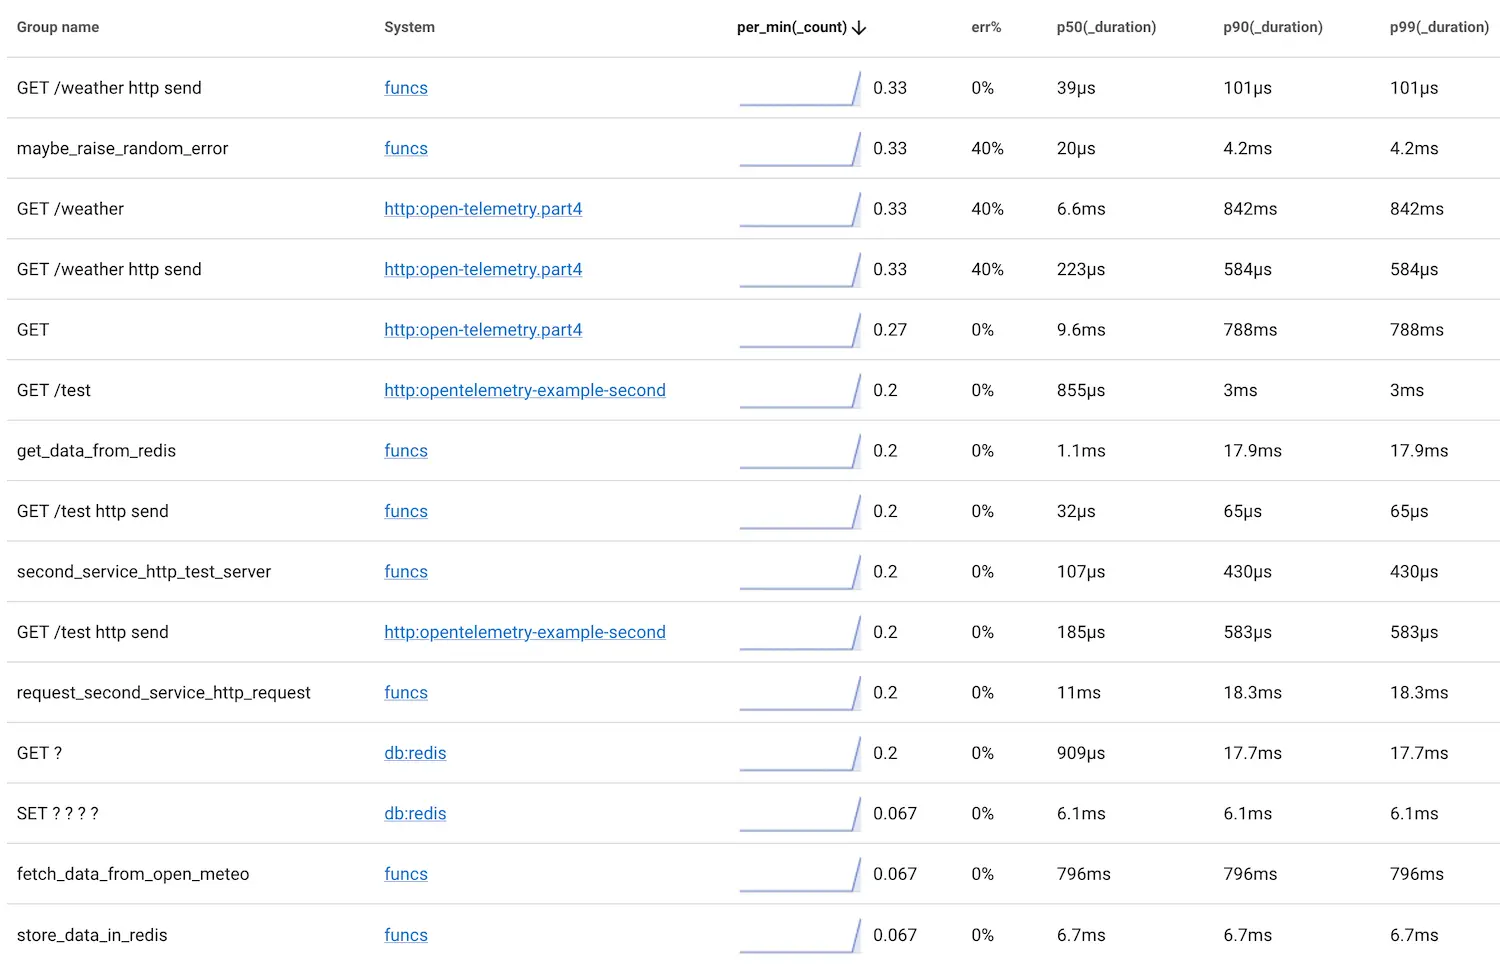
The following shows an overview of all spans in the system.
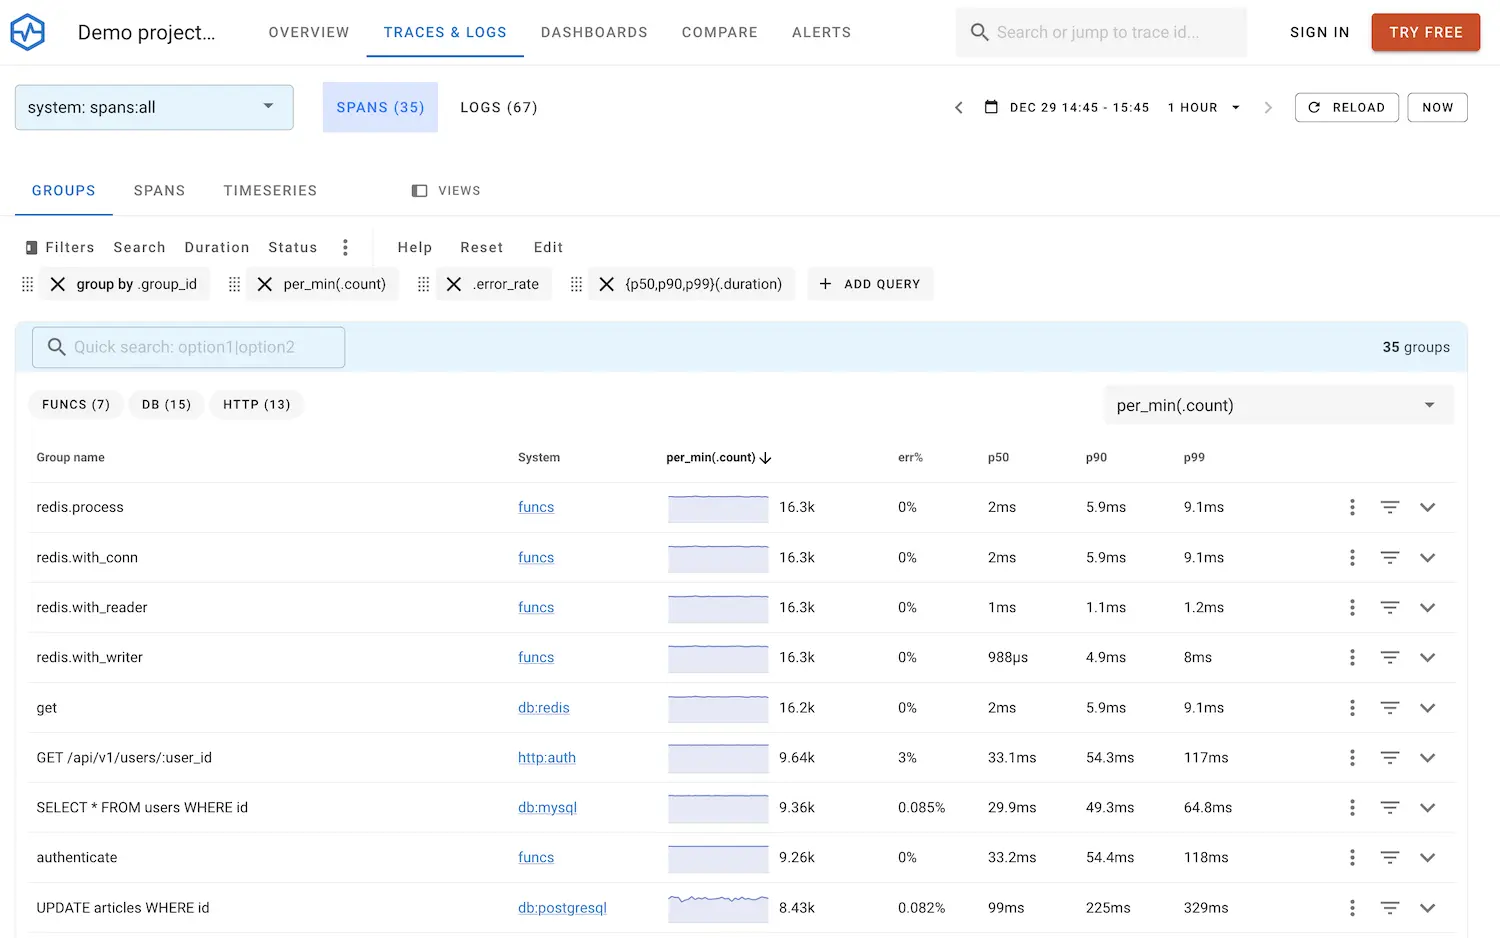
Here you can see the single spans behind a span group.
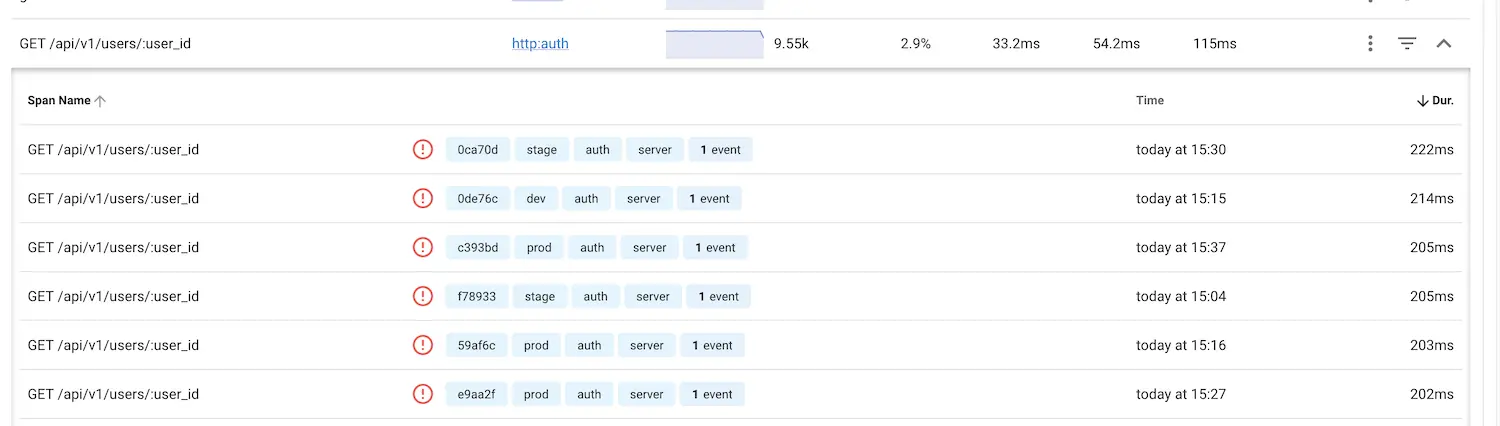
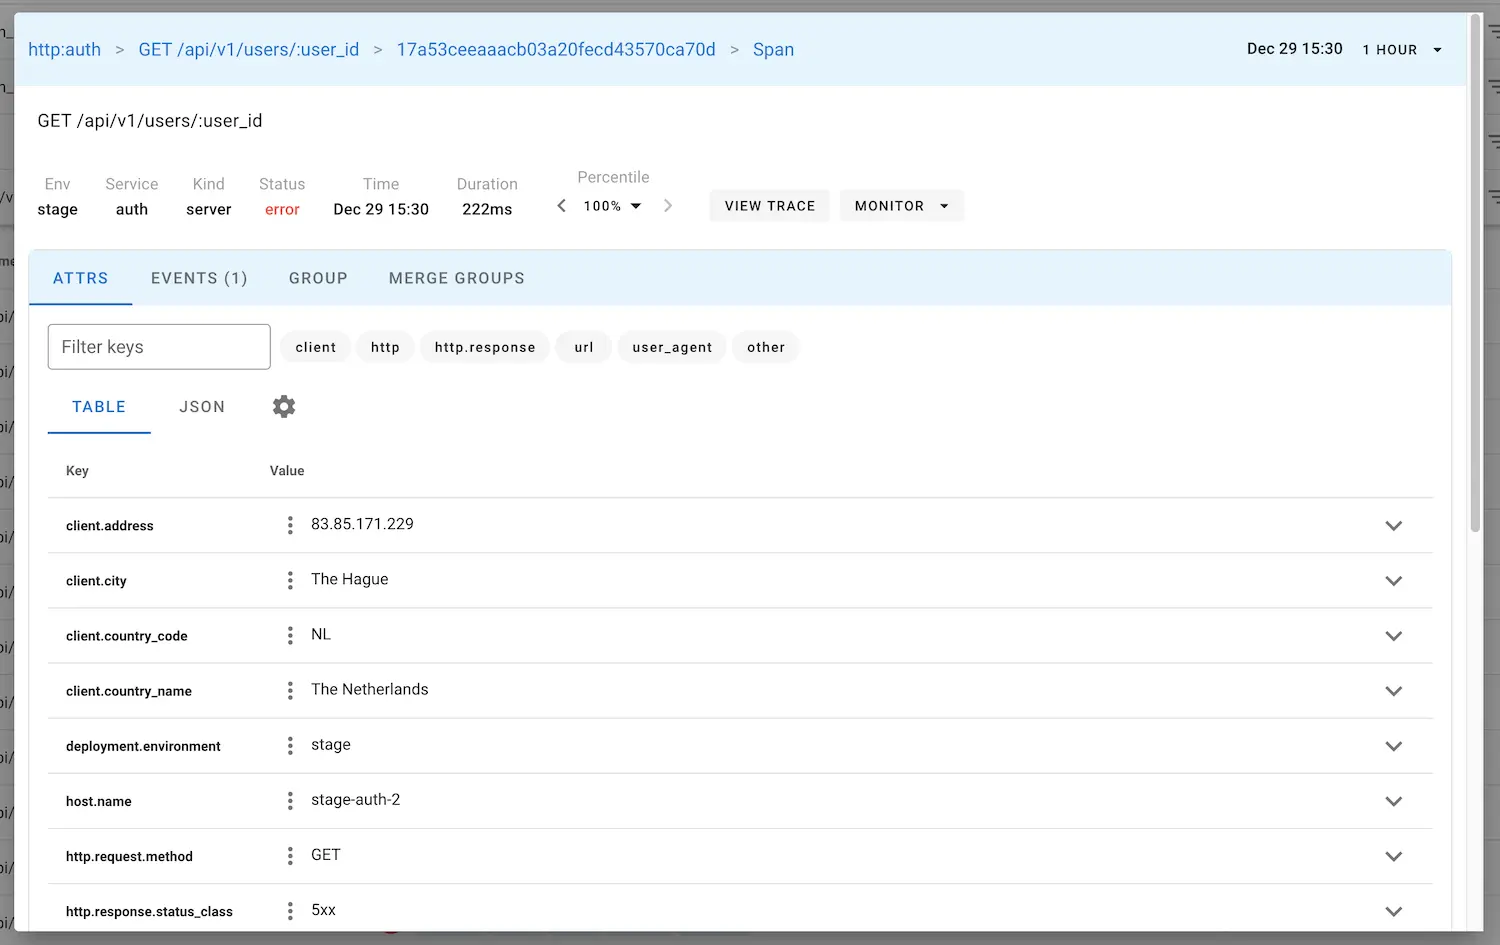
Upon clicking on a span, you can see the details:
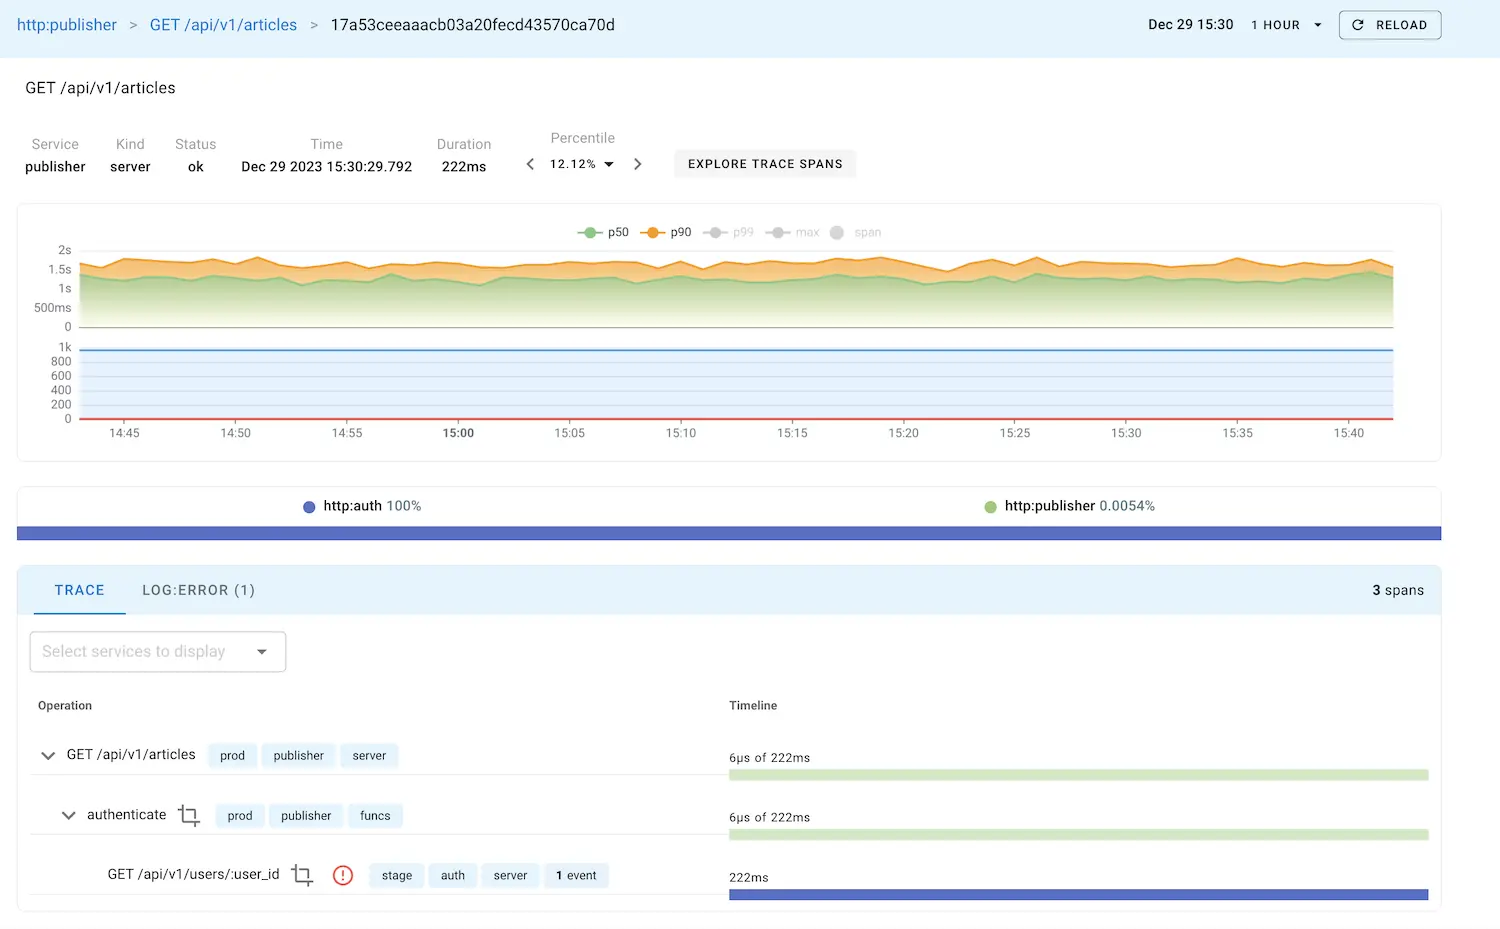
By clicking on the number in bread crumb, you go to the trace, which has all the spans and logs available of the request.
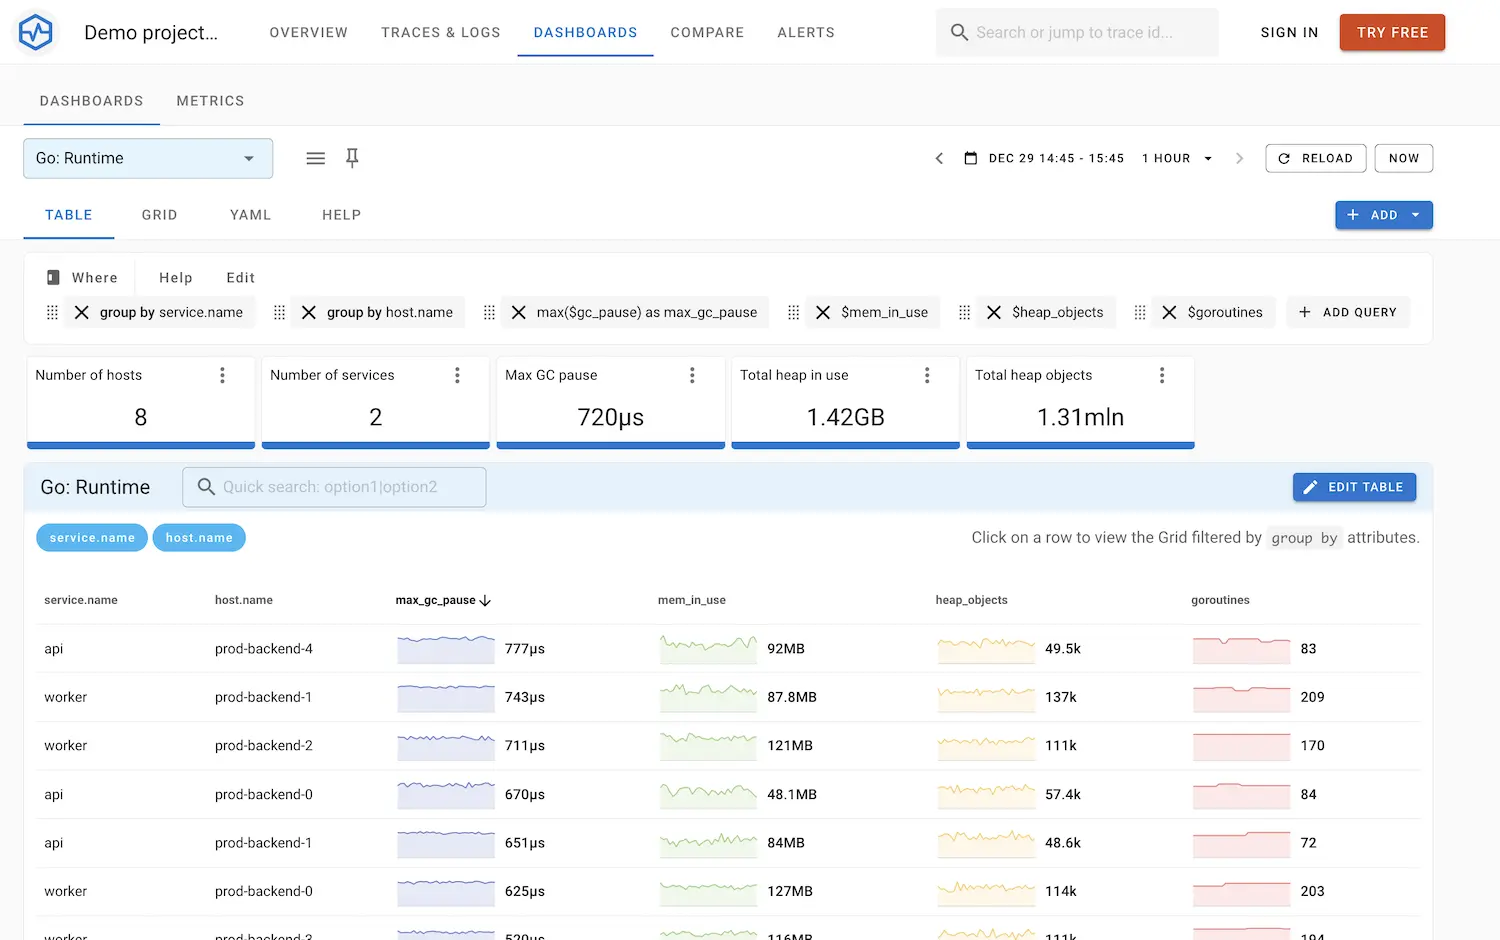
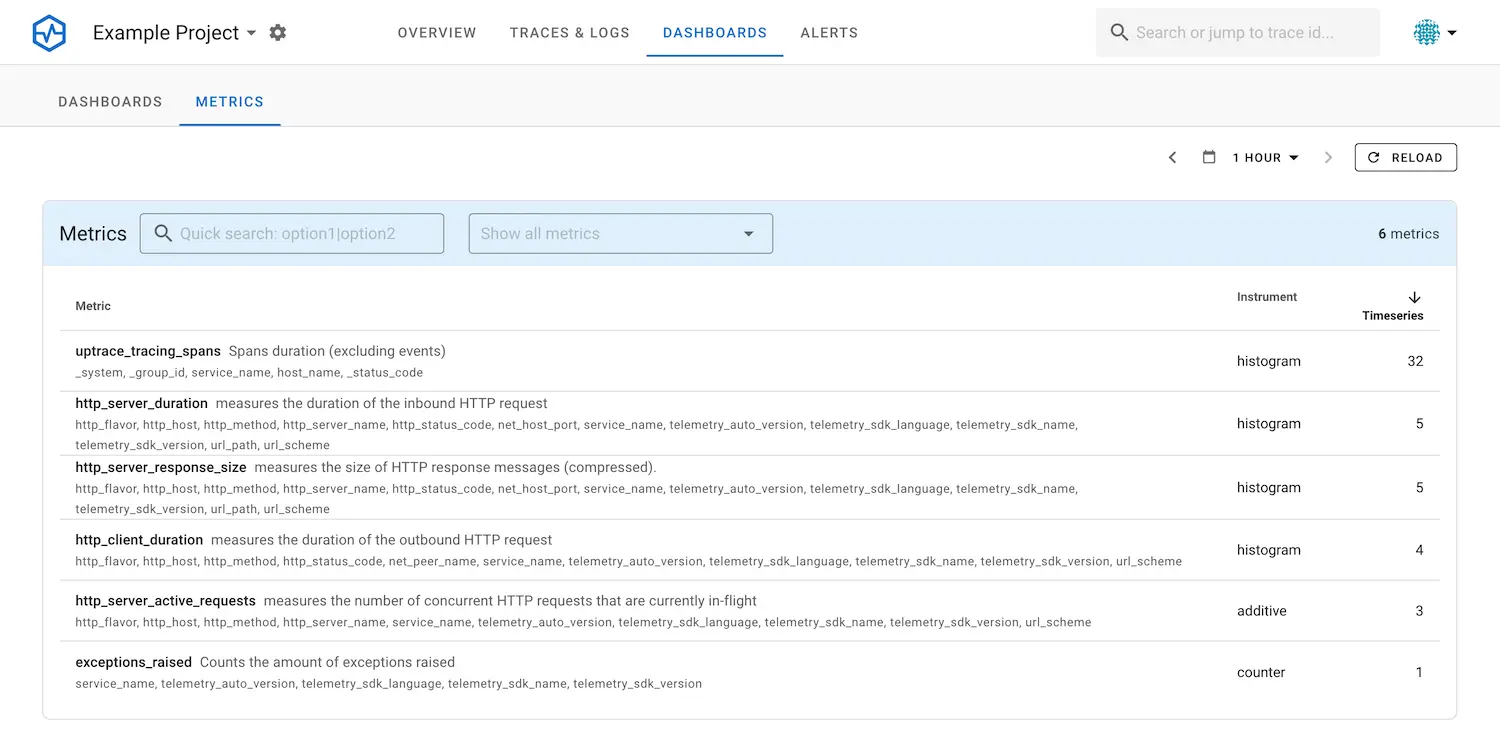
Besides the trace, you can also see the metrics of your application.
Enough of showcasing Uptrace, let’s build an example Python app that uses open telemetry!
Implementation Time #
So, we introduced OpenTelemetry and Uptrace, let’s get going with an example app.
If you want to get straight to the source code and try it out, please check out the prepared repository with all the code: https://github.com/Ecostack/opentelemetry-python-example
To show the abilities of OpenTelemetry, we will first build a REST API server which allows us to get weather data based on longitude and latitude. Later on, we will increase the complexity with caching, random errors, and calling a second open telemetry instrumented service.
Initial Setup: Python and Uptrace Configuration #
Before we continue, make sure to have Python3 and Docker installed on your machine.
Let’s also setup Uptrace on your local machine. For that, please clone my prepared repository.
git clone https://github.com/Ecostack/opentelemetry-python-example
cd opentelemetry-python-example/uptrace-docker && docker compose up
You should now be able to log in at http://localhost:14318 with these login credentials:
email: uptrace@localhost
password: SomeRandomPassword
Part 1 - Rest API with weather data call #
For the setup of the rest API we will use FastAPI and for the requests, the requests library.
Requirements #
Required libraries:
pip install "fastapi[all]" requests
For OpenTelemetry:
pip install opentelemetry-instrumentation opentelemetry-distro opentelemetry-exporter-otlp-proto-grpc
Execute the following to automatically install open-telemetry libraries based on the current used libraries. It will install libs for FastAPI and requests.
opentelemetry-bootstrap -a install
Let’s add the part1.py code
import requests
import logging
from fastapi import FastAPI, HTTPException, Query
from opentelemetry import trace
from opentelemetry.instrumentation.fastapi import FastAPIInstrumentor
from opentelemetry.instrumentation.requests import RequestsInstrumentor
from opentelemetry.sdk.trace import TracerProvider

# Create FastAPI app
app = FastAPI()

# Set up the TracerProvider
trace.set_tracer_provider(TracerProvider())

# Creates a tracer from the global tracer provider
tracer = trace.get_tracer("open-telemetry.part1")

# Setup the logger and set minimum log level to info, everything below will not be logged
logger = logging.getLogger(__name__)
logger.setLevel(logging.INFO)

# Instrument FastAPI and Requests
FastAPIInstrumentor.instrument_app(app)
RequestsInstrumentor().instrument()

# Example logging from part 1
logger.info("hello from part 1")

# Tracer annotation which will automatically create a span for this function
@tracer.start_as_current_span("fetch_data_from_open_meteo")
def fetch_data_from_open_meteo(latitude, longitude):
    # Alternative way of creating a span
    # with tracer.start_as_current_span("fetch_data_from_open_meteo") as span:

    logger.info('Fetching weather data from Open-Meteo')
    # Define the parameters for your request here
    params = {
        'latitude': latitude,  # Example latitude
        'longitude': longitude,  # Example longitude
        'hourly': 'temperature_2m'
    }

    # Make a GET request to the Open-Meteo API using requests
    response = requests.get('https://api.open-meteo.com/v1/forecast', params=params)

    logger.info('Received response from Open-Meteo %s', response)
    if response.status_code == 200:
        return response.json()
    else:
        # Handle errors
        raise HTTPException(status_code=500, detail='Failed to fetch data from Open-Meteo')


# Endpoint for getting weather data, defined via annotation and using Query parameters
@app.get('/weather')
async def get_weather(latitude: float = Query(..., description="Latitude of the location"),
                      longitude: float = Query(..., description="Longitude of the location")):
    data = fetch_data_from_open_meteo(latitude, longitude)

    return data
Start part 1 via bash script that defines also environment variables.
#!/usr/bin/env bash

## Enable this here to see debug messages
#export GRPC_VERBOSITY=debug
#export GRPC_TRACE=http,call_error,connectivity_state

export OTEL_SERVICE_NAME=open-telemetry.part1

export OTEL_TRACES_EXPORTER=otlp
export OTEL_LOGS_EXPORTER=otlp
export OTEL_METRICS_EXPORTER=otlp

export OTEL_PYTHON_LOGGING_AUTO_INSTRUMENTATION_ENABLED=true
export OTEL_PYTHON_LOG_CORRELATION=true
export OTEL_PYTHON_LOG_LEVEL=info

# Enable gzip compression.
export OTEL_EXPORTER_OTLP_COMPRESSION=gzip
# Prefer delta temporality.
export OTEL_EXPORTER_OTLP_METRICS_TEMPORALITY_PREFERENCE=DELTA

# Uptrace Login
export OTEL_EXPORTER_OTLP_HEADERS="uptrace-dsn=http://SomeRandomToken@localhost:14318?grpc=14317"

# Export endpoint, local Uptrace instance
export OTEL_EXPORTER_OTLP_ENDPOINT=127.0.0.1:14317
export OTEL_EXPORTER_OTLP_INSECURE=true

opentelemetry-instrument uvicorn part1:app --port 8000
Let’s start this one:
bash ./start_part1.sh
Now with the part 1 running on port 8000, we can trigger the first request.
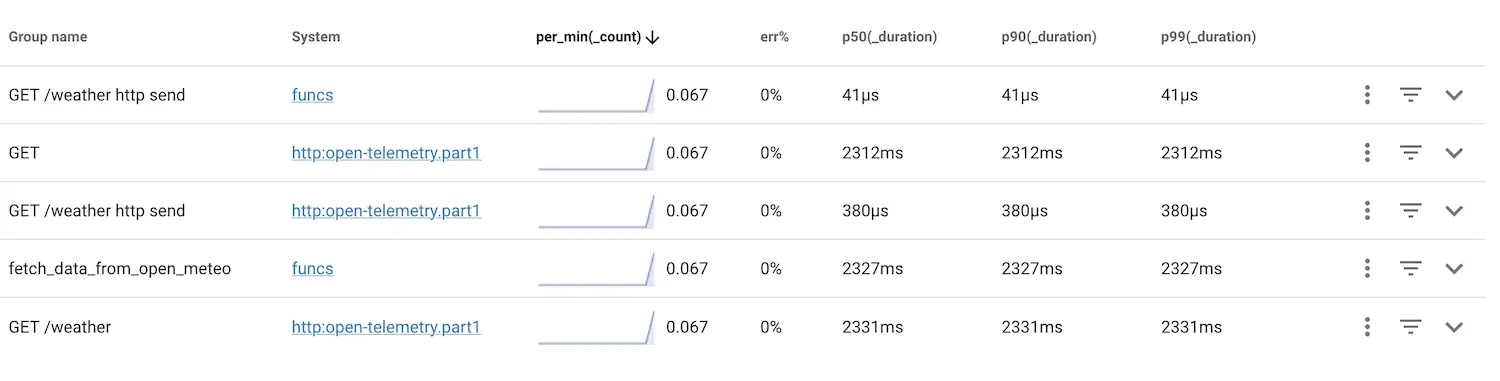
curl http://127.0.0.1:8000/weather?latitude=52.374&longitude=4.8897
Inside of Uptrace, we should be able to see these spans now:
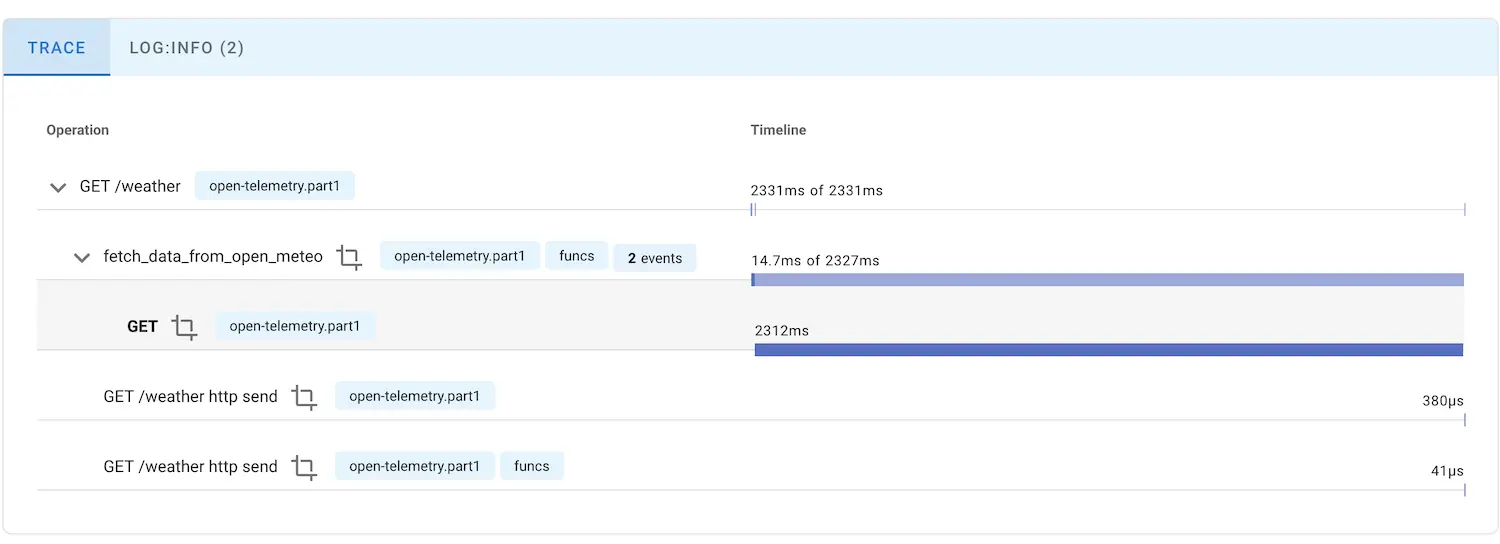
Clicking on a trace, we should be able to see this:
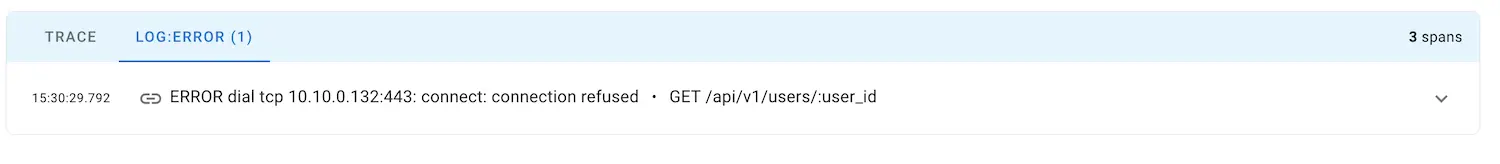
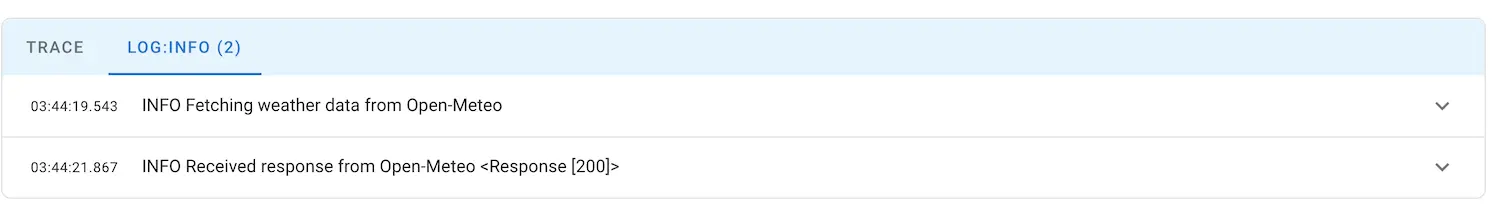
There we can also see the logs:
Part 2 - Add some caching via Redis #
Since weather does not change every second, let’s cache the returned data for a while. We will use Redis and store the weather data based on the request parameters for some seconds.
pip install redis opentelemetry-instrumentation-redis
At first add the import and the Redis client definition
If you used the
docker-compose.ymlfrom the repository, Redis is already running
import redis

# Connect to Redis
# Replace 'localhost' and '6379' with your Redis server's host and port if different
redis_client = redis.Redis(host='localhost', port=6379, db=0)
Further down, let’s add the Redis related functions
def get_redis_key(latitude, longitude):
    # Create a unique key for the Redis entry
    return 'weather_data_' + str(latitude) + '_' + str(longitude)

@tracer.start_as_current_span("get_data_from_redis")
def get_data_from_redis(latitude, longitude):
    logger.info('Checking Redis for weather data')
    redisKey = get_redis_key(latitude, longitude)
    redisData = redis_client.get(redisKey)
    if redisData is not None:
        logger.info('Found weather data in Redis')
        return redisData

@tracer.start_as_current_span("store_data_in_redis")
def store_data_in_redis(latitude, longitude, data):
    logger.info('Storing weather data in Redis')
    redisKey = get_redis_key(latitude, longitude)
    # Store the data in Redis with a TTL of 4 seconds
    redis_client.set(redisKey, str(data), ex=4)
Let’s change the endpoint to the following code:
@app.get('/weather')
async def get_weather(latitude: float = Query(..., description="Latitude of the location"),
                      longitude: float = Query(..., description="Longitude of the location")):
    # Check Redis for weather data
    redisData = get_data_from_redis(latitude, longitude)
    if redisData is not None:
        # Return data from Redis if it exists
        return redisData

    # Fetch data from Open-Meteo
    data = fetch_data_from_open_meteo(latitude, longitude)

    # Store data in Redis
    store_data_in_redis(latitude, longitude, data)

    return data
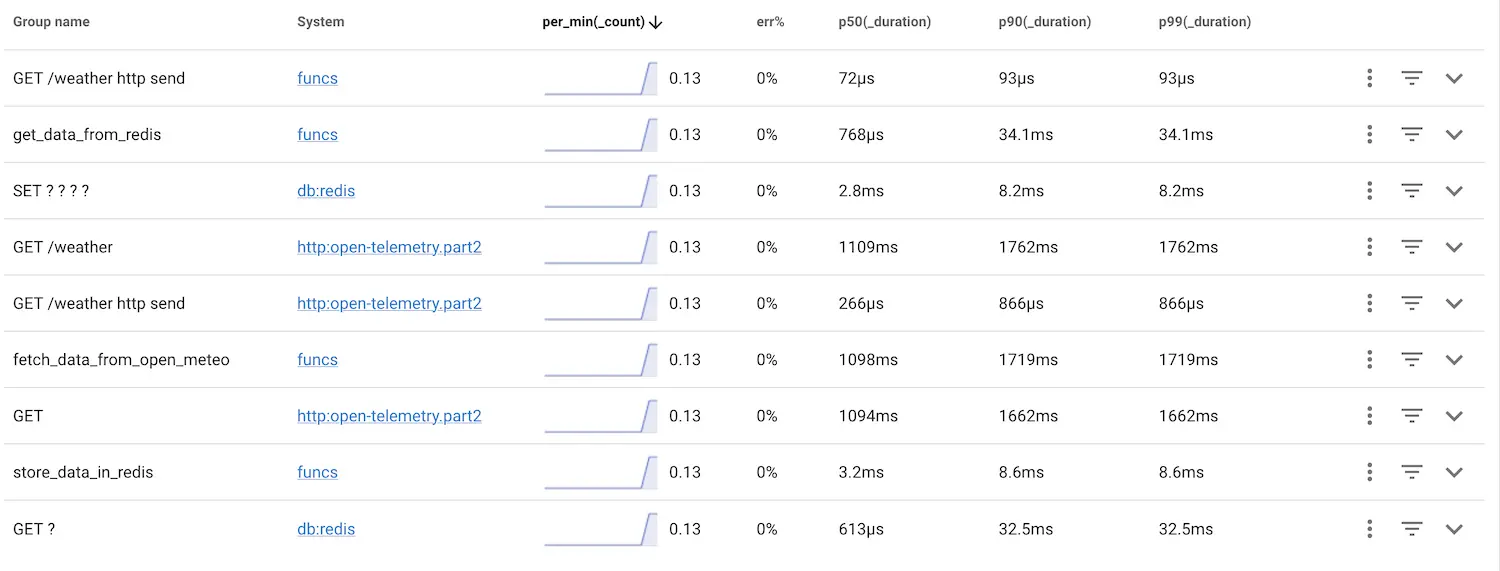
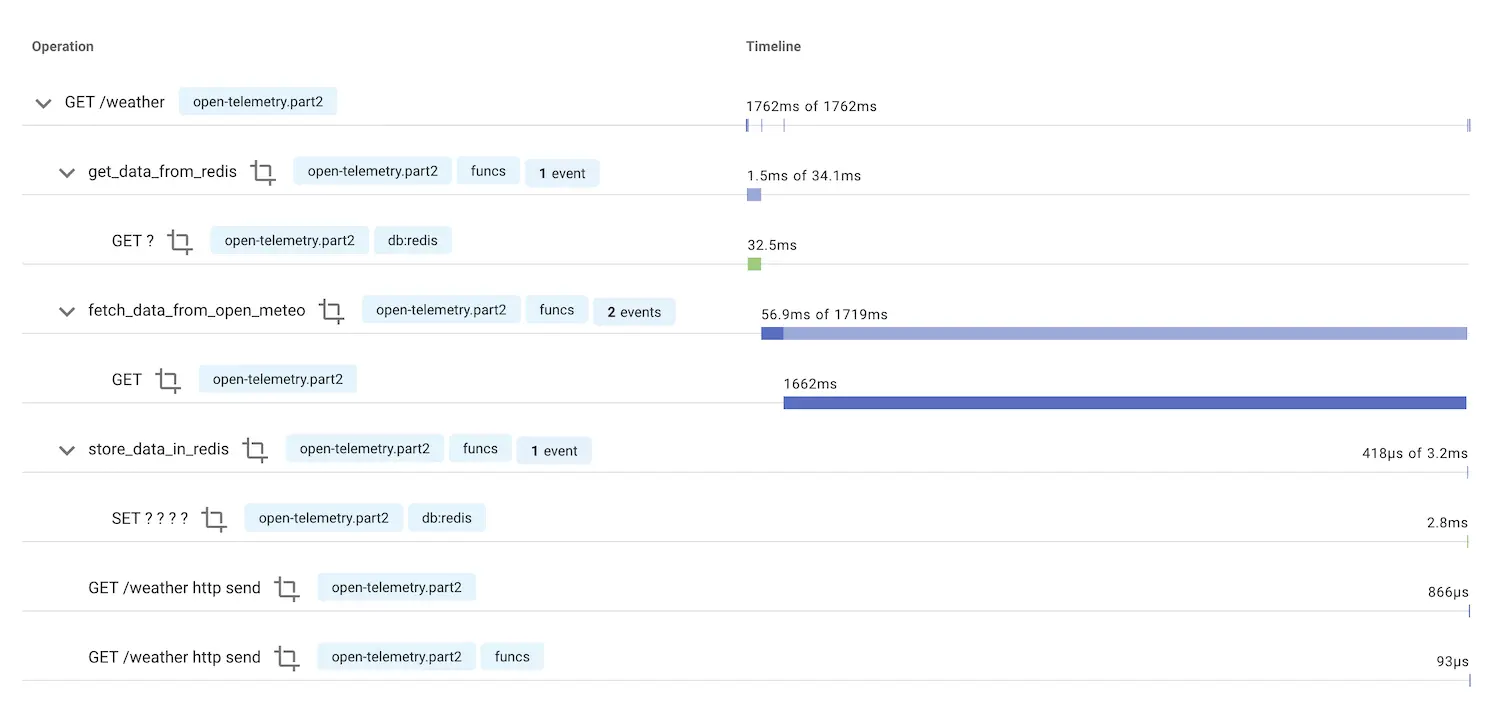
If we now trigger the test curl again a couple of times, we should be able to see the Redis GET and SET commands be part of the overview and traces.
curl "http://127.0.0.1:8000/weather?latitude=52.374&longitude=4.8897"
Clicking on a trace, we should be able to see this:
Full code after part 2:
import requests
import logging
import redis

from fastapi import FastAPI, HTTPException, Query
from opentelemetry import trace
from opentelemetry.instrumentation.fastapi import FastAPIInstrumentor
from opentelemetry.instrumentation.requests import RequestsInstrumentor
from opentelemetry.sdk.trace import TracerProvider

# Create FastAPI app
app = FastAPI()

# Set up the TracerProvider
trace.set_tracer_provider(TracerProvider())

# Creates a tracer from the global tracer provider
tracer = trace.get_tracer("open-telemetry.part2")

# Setup the logger and set minimum log level to info, everything below will not be logged
logger = logging.getLogger(__name__)
logger.setLevel(logging.INFO)

# Instrument FastAPI and Requests
FastAPIInstrumentor.instrument_app(app)
RequestsInstrumentor().instrument()

# Connect to Redis
# Replace 'localhost' and '6379' with your Redis server's host and port if different
redis_client = redis.Redis(host='localhost', port=6379, db=0)

logger.info("hello from part 2")


def get_redis_key(latitude, longitude):
    # Create a unique key for the Redis entry
    return 'weather_data_' + str(latitude) + '_' + str(longitude)

@tracer.start_as_current_span("get_data_from_redis")
def get_data_from_redis(latitude, longitude):
    logger.info('Checking Redis for weather data')
    redisKey = get_redis_key(latitude, longitude)
    redisData = redis_client.get(redisKey)
    if redisData is not None:
        logger.info('Found weather data in Redis')
        return redisData

@tracer.start_as_current_span("store_data_in_redis")
def store_data_in_redis(latitude, longitude, data):
    logger.info('Storing weather data in Redis')
    redisKey = get_redis_key(latitude, longitude)
    # Store the data in Redis with a TTL of 4 seconds
    redis_client.set(redisKey, str(data), ex=4)


# Tracer annotation which will automatically create a span for this function
@tracer.start_as_current_span("fetch_data_from_open_meteo")
def fetch_data_from_open_meteo(latitude, longitude):
    # Alternative way of creating a span
    # with tracer.start_as_current_span("fetch_data_from_open_meteo") as span:

    logger.info('Fetching weather data from Open-Meteo')
    # Define the parameters for your request here
    params = {
        'latitude': latitude,  # Example latitude
        'longitude': longitude,  # Example longitude
        'hourly': 'temperature_2m'
    }

    # Make a GET request to the Open-Meteo API using requests
    response = requests.get('https://api.open-meteo.com/v1/forecast', params=params)

    logger.info('Received response from Open-Meteo %s', response)
    if response.status_code == 200:
        return response.json()
    else:
        # Handle errors
        raise HTTPException(status_code=500, detail='Failed to fetch data from Open-Meteo')


# Endpoint for getting weather data, defined via annotation and using Query parameters
@app.get('/weather')
async def get_weather(latitude: float = Query(..., description="Latitude of the location"),
                      longitude: float = Query(..., description="Longitude of the location")):
    # Check Redis for weather data
    redisData = get_data_from_redis(latitude, longitude)
    if redisData is not None:
        # Return data from Redis if it exists
        return redisData

    # Fetch data from Open-Meteo
    data = fetch_data_from_open_meteo(latitude, longitude)

    # Store data in Redis
    store_data_in_redis(latitude, longitude, data)

    return data
Part 3 - Adding errors #
So far, we have been mostly error free, let’s create a random error if the endpoint is hit.
Add the random library
import random
Add a function that randomly raises an error
@tracer.start_as_current_span("maybe_raise_random_error")
def maybe_raise_random_error():
    if random.random() < 0.5:
        logger.error('Random error occurred')
        # Return an error response 50% of the time
        raise HTTPException(status_code=500, detail='Random error occurred')
Change end API endpoint
@app.get('/weather')
async def get_weather(latitude: float = Query(..., description="Latitude of the location"),
                      longitude: float = Query(..., description="Longitude of the location")):
    maybe_raise_random_error()

    # Check Redis for weather data
    redisData = get_data_from_redis(latitude, longitude)
    if redisData is not None:
        # Return data from Redis if it exists
        return redisData

    # Fetch data from Open-Meteo
    data = fetch_data_from_open_meteo(latitude, longitude)

    # Store data in Redis
    store_data_in_redis(latitude, longitude, data)

    return data
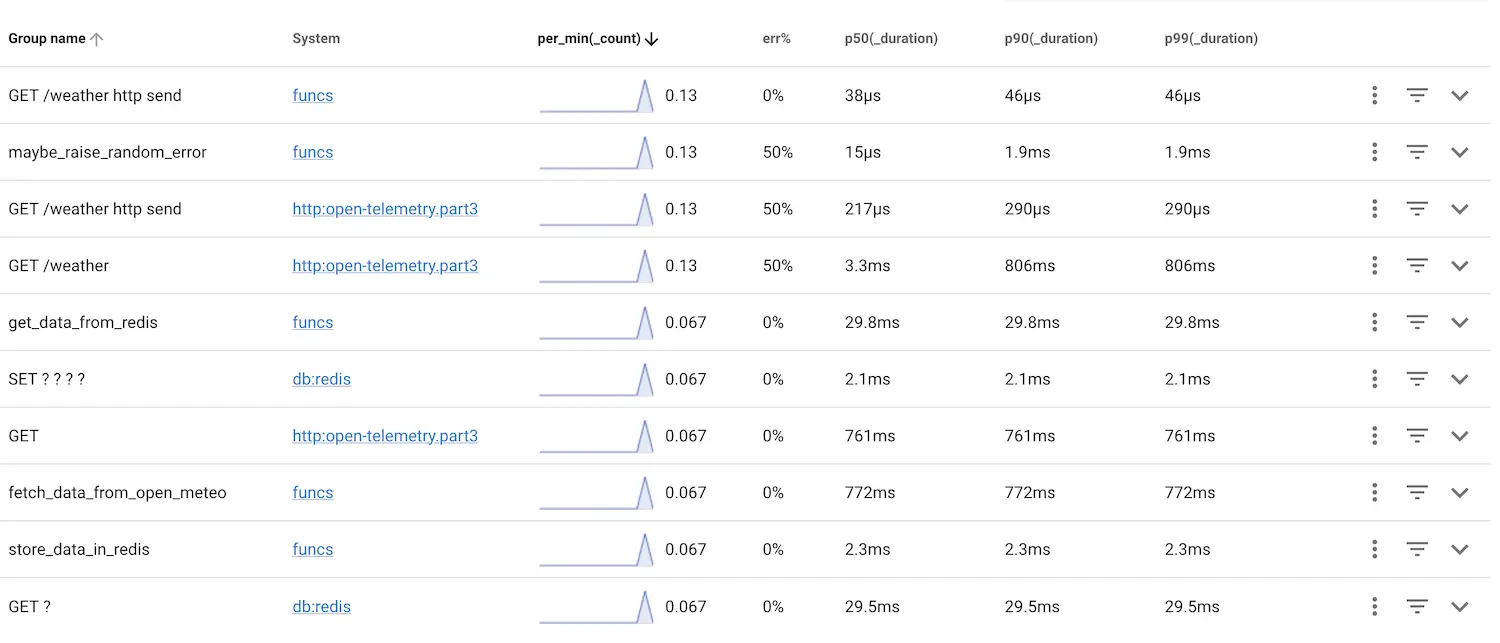
After restarting the code and triggering the curl a couple of times, you should be able to see that the errors rise for the endpoint, like so:
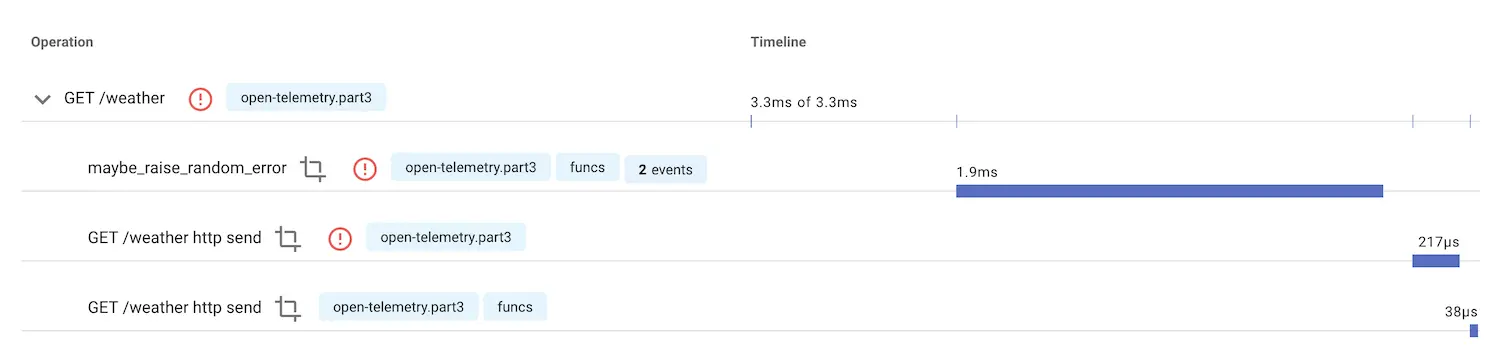
Clicking on a trace, we should be able to see this:
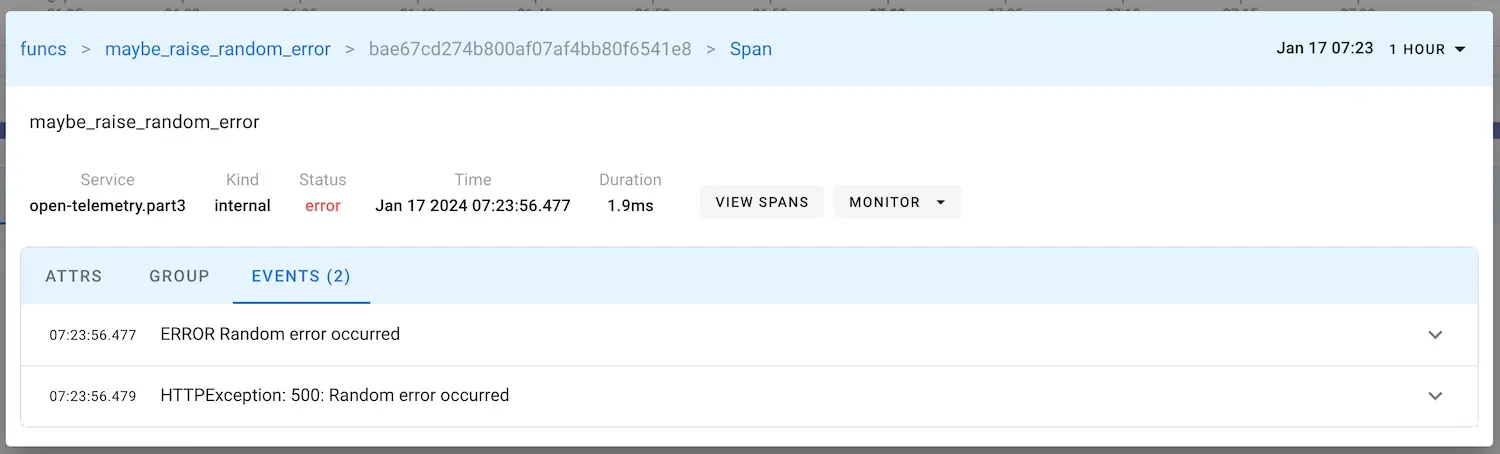
If we open up the error span, we can see the error and the error log:
Full code after part 3:
import requests
import logging
import redis

from fastapi import FastAPI, HTTPException, Query
from opentelemetry import trace
from opentelemetry.instrumentation.fastapi import FastAPIInstrumentor
from opentelemetry.instrumentation.requests import RequestsInstrumentor
from opentelemetry.sdk.trace import TracerProvider
import random


# Create FastAPI app
app = FastAPI()

# Set up the TracerProvider
trace.set_tracer_provider(TracerProvider())

# Creates a tracer from the global tracer provider
tracer = trace.get_tracer("open-telemetry.part3")

# Setup the logger and set minimum log level to info, everything below will not be logged
logger = logging.getLogger(__name__)
logger.setLevel(logging.INFO)

# Instrument FastAPI and Requests
FastAPIInstrumentor.instrument_app(app)
RequestsInstrumentor().instrument()

# Connect to Redis
# Replace 'localhost' and '6379' with your Redis server's host and port if different
redis_client = redis.Redis(host='localhost', port=6379, db=0)

logger.info("hello from part 3")


def get_redis_key(latitude, longitude):
    # Create a unique key for the Redis entry
    return 'weather_data_' + str(latitude) + '_' + str(longitude)

@tracer.start_as_current_span("get_data_from_redis")
def get_data_from_redis(latitude, longitude):
    logger.info('Checking Redis for weather data')
    redisKey = get_redis_key(latitude, longitude)
    redisData = redis_client.get(redisKey)
    if redisData is not None:
        logger.info('Found weather data in Redis')
        return redisData

@tracer.start_as_current_span("store_data_in_redis")
def store_data_in_redis(latitude, longitude, data):
    logger.info('Storing weather data in Redis')
    redisKey = get_redis_key(latitude, longitude)
    # Store the data in Redis with a TTL of 4 seconds
    redis_client.set(redisKey, str(data), ex=4)


# Tracer annotation which will automatically create a span for this function
@tracer.start_as_current_span("fetch_data_from_open_meteo")
def fetch_data_from_open_meteo(latitude, longitude):
    # Alternative way of creating a span
    # with tracer.start_as_current_span("fetch_data_from_open_meteo") as span:

    logger.info('Fetching weather data from Open-Meteo')
    # Define the parameters for your request here
    params = {
        'latitude': latitude,  # Example latitude
        'longitude': longitude,  # Example longitude
        'hourly': 'temperature_2m'
    }

    # Make a GET request to the Open-Meteo API using requests
    response = requests.get('https://api.open-meteo.com/v1/forecast', params=params)

    logger.info('Received response from Open-Meteo %s', response)
    if response.status_code == 200:
        return response.json()
    else:
        # Handle errors
        raise HTTPException(status_code=500, detail='Failed to fetch data from Open-Meteo')

@tracer.start_as_current_span("maybe_raise_random_error")
def maybe_raise_random_error():
    if random.random() < 0.5:
        # exceptions_raised_counter.add(1, {"exception.type": HTTPException})
        logger.error('Random error occurred')
        # Return an error response 50% of the time
        raise HTTPException(status_code=500, detail='Random error occurred')


# Endpoint for getting weather data, defined via annotation and using Query parameters
@app.get('/weather')
async def get_weather(latitude: float = Query(..., description="Latitude of the location"),
                      longitude: float = Query(..., description="Longitude of the location")):
    maybe_raise_random_error()

    # Check Redis for weather data
    redisData = get_data_from_redis(latitude, longitude)
    if redisData is not None:
        # Return data from Redis if it exists
        return redisData

    # Fetch data from Open-Meteo
    data = fetch_data_from_open_meteo(latitude, longitude)

    # Store data in Redis
    store_data_in_redis(latitude, longitude, data)

    return data
Part 4 - Multi service trace #
For the last part, I want to show how traces can cross services.
Create a new file called second_service.py:
import random

import requests
import logging
import redis
from fastapi import FastAPI, HTTPException, Query
from opentelemetry import trace
from opentelemetry.instrumentation.fastapi import FastAPIInstrumentor
from opentelemetry.instrumentation.requests import RequestsInstrumentor
from opentelemetry.sdk.trace import TracerProvider

# Create FastAPI app
app = FastAPI()

# Set up the TracerProvider
trace.set_tracer_provider(TracerProvider())

# Creates a tracer from the global tracer provider
tracer = trace.get_tracer("open-telemetry.example.second-service")

# logging.basicConfig(level=logging.INFO)
logger = logging.getLogger(__name__)
logger.setLevel(logging.INFO)

# Instrument FastAPI
FastAPIInstrumentor.instrument_app(app)

logger.info("hello from startup second service")


@app.get('/test')
async def test():
    with tracer.start_as_current_span("second_service_http_test_server") as span:
        logger.info("test - hey there from the second service")
        return "Hey there"
Start the second service via this script, it will start it on port 8001
#!/usr/bin/env bash

#export GRPC_VERBOSITY=debug
#export GRPC_TRACE=http,call_error,connectivity_state

export OTEL_SERVICE_NAME=opentelemetry-example-second

export OTEL_TRACES_EXPORTER=otlp
export OTEL_LOGS_EXPORTER=otlp
export OTEL_METRICS_EXPORTER=otlp

export OTEL_PYTHON_LOGGING_AUTO_INSTRUMENTATION_ENABLED=true
export OTEL_PYTHON_LOG_CORRELATION=true
export OTEL_PYTHON_LOG_LEVEL=info

# Enable gzip compression.
export OTEL_EXPORTER_OTLP_COMPRESSION=gzip
# Prefer delta temporality.
export OTEL_EXPORTER_OTLP_METRICS_TEMPORALITY_PREFERENCE=DELTA

# Uptrace Login
export OTEL_EXPORTER_OTLP_HEADERS="uptrace-dsn=http://SomeRandomToken@localhost:14318?grpc=14317"

# Export endpoint, local Uptrace instance
export OTEL_EXPORTER_OTLP_ENDPOINT=127.0.0.1:14317
export OTEL_EXPORTER_OTLP_INSECURE=true

opentelemetry-instrument uvicorn second_service:app --port 8001
Further on, let’s edit our main service to call the second service!
Add the function for requesting the second service and the changes to the get_weather API endpoint.
@tracer.start_as_current_span("request_second_service_http_request")
def request_second_service_http_request():
    logger.info('Requesting second service')
    response = requests.get('http://localhost:8001/test')
    logger.info('Received response from second service %s', response)
    if response.status_code == 200:
        return response.json()
    else:
        # Handle errors
        raise HTTPException(status_code=500, detail='Failed to fetch data from second service')

# Endpoint for getting weather data, defined via annotation and using Query parameters
@app.get('/weather')
async def get_weather(latitude: float = Query(..., description="Latitude of the location"),
                      longitude: float = Query(..., description="Longitude of the location")):
    maybe_raise_random_error()

    request_second_service_http_request()

    # Check Redis for weather data
    redisData = get_data_from_redis(latitude, longitude)
    if redisData is not None:
        # Return data from Redis if it exists
        return redisData

    # Fetch data from Open-Meteo
    data = fetch_data_from_open_meteo(latitude, longitude)

    # Store data in Redis
    store_data_in_redis(latitude, longitude, data)

    return data
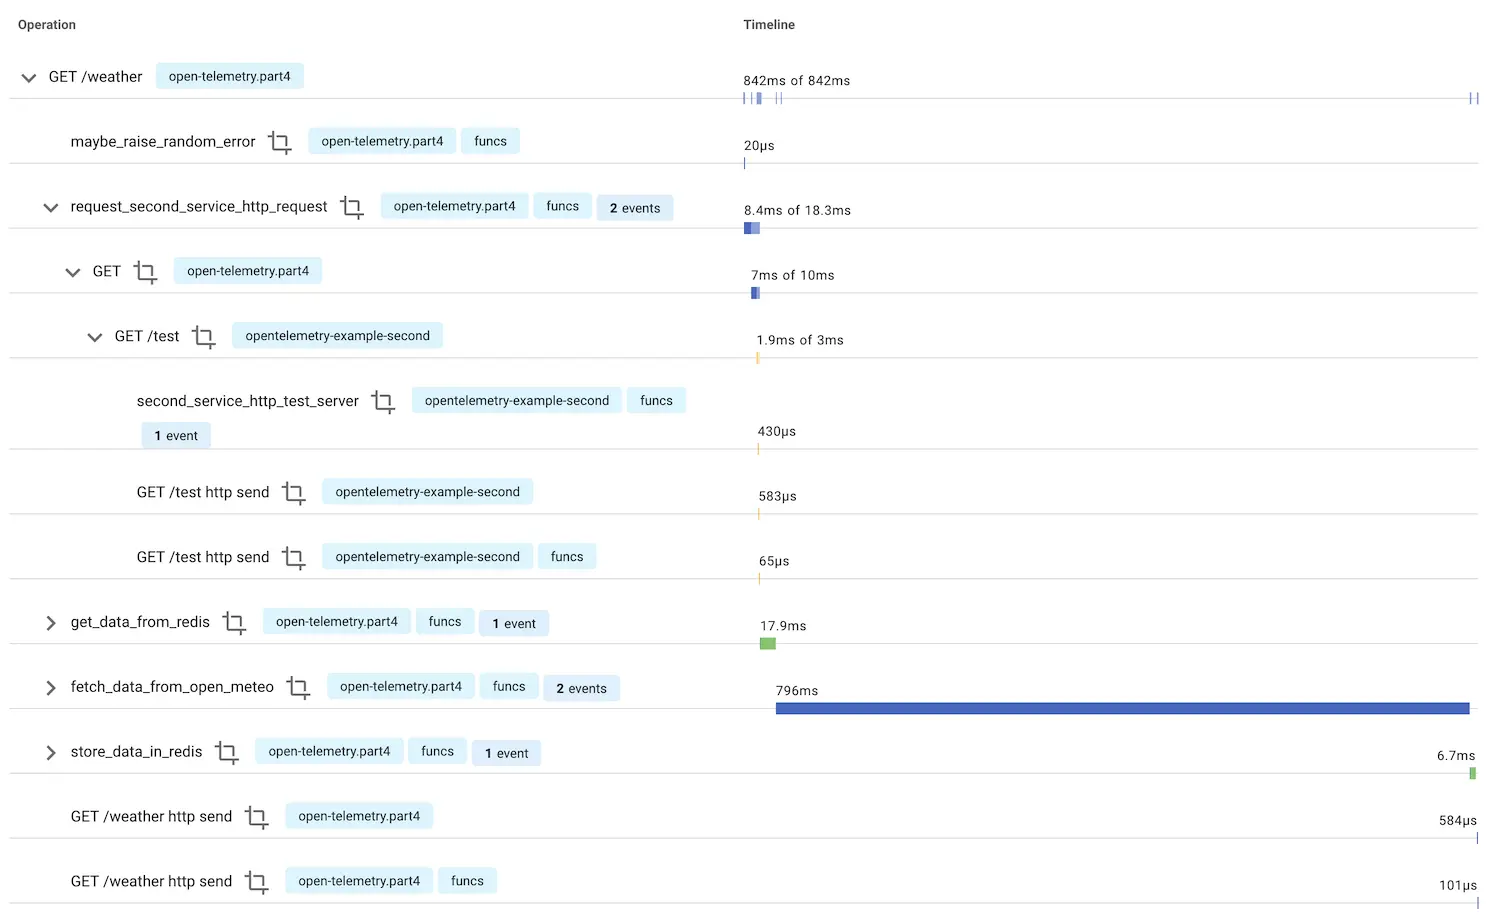
Start both of our services and trigger a couple of requests. We should be able to see span from both services!
Clicking on a trace, we should be able to see this:
Full code after part 4:
import requests
import logging
import redis

from fastapi import FastAPI, HTTPException, Query
from opentelemetry import trace
from opentelemetry.instrumentation.fastapi import FastAPIInstrumentor
from opentelemetry.instrumentation.requests import RequestsInstrumentor
from opentelemetry.sdk.trace import TracerProvider
import random


# Create FastAPI app
app = FastAPI()

# Set up the TracerProvider
trace.set_tracer_provider(TracerProvider())

# Creates a tracer from the global tracer provider
tracer = trace.get_tracer("open-telemetry.part4")

# Setup the logger and set minimum log level to info, everything below will not be logged
logger = logging.getLogger(__name__)
logger.setLevel(logging.INFO)

# Instrument FastAPI and Requests
FastAPIInstrumentor.instrument_app(app)
RequestsInstrumentor().instrument()

# Connect to Redis
# Replace 'localhost' and '6379' with your Redis server's host and port if different
redis_client = redis.Redis(host='localhost', port=6379, db=0)

logger.info("hello from part 3")


def get_redis_key(latitude, longitude):
    # Create a unique key for the Redis entry
    return 'weather_data_' + str(latitude) + '_' + str(longitude)

@tracer.start_as_current_span("get_data_from_redis")
def get_data_from_redis(latitude, longitude):
    logger.info('Checking Redis for weather data')
    redisKey = get_redis_key(latitude, longitude)
    redisData = redis_client.get(redisKey)
    if redisData is not None:
        logger.info('Found weather data in Redis')
        return redisData

@tracer.start_as_current_span("store_data_in_redis")
def store_data_in_redis(latitude, longitude, data):
    logger.info('Storing weather data in Redis')
    redisKey = get_redis_key(latitude, longitude)
    # Store the data in Redis with a TTL of 4 seconds
    redis_client.set(redisKey, str(data), ex=4)


# Tracer annotation which will automatically create a span for this function
@tracer.start_as_current_span("fetch_data_from_open_meteo")
def fetch_data_from_open_meteo(latitude, longitude):
    # Alternative way of creating a span
    # with tracer.start_as_current_span("fetch_data_from_open_meteo") as span:

    logger.info('Fetching weather data from Open-Meteo')
    # Define the parameters for your request here
    params = {
        'latitude': latitude,  # Example latitude
        'longitude': longitude,  # Example longitude
        'hourly': 'temperature_2m'
    }

    # Make a GET request to the Open-Meteo API using requests
    response = requests.get('https://api.open-meteo.com/v1/forecast', params=params)

    logger.info('Received response from Open-Meteo %s', response)
    if response.status_code == 200:
        return response.json()
    else:
        # Handle errors
        raise HTTPException(status_code=500, detail='Failed to fetch data from Open-Meteo')

@tracer.start_as_current_span("maybe_raise_random_error")
def maybe_raise_random_error():
    if random.random() < 0.5:
        # exceptions_raised_counter.add(1, {"exception.type": HTTPException})
        logger.error('Random error occurred')
        # Return an error response 50% of the time
        raise HTTPException(status_code=500, detail='Random error occurred')

@tracer.start_as_current_span("request_second_service_http_request")
def request_second_service_http_request():
    logger.info('Requesting second service')
    response = requests.get('http://localhost:8001/test')
    logger.info('Received response from second service %s', response)
    if response.status_code == 200:
        return response.json()
    else:
        # Handle errors
        raise HTTPException(status_code=500, detail='Failed to fetch data from second service')

# Endpoint for getting weather data, defined via annotation and using Query parameters
@app.get('/weather')
async def get_weather(latitude: float = Query(..., description="Latitude of the location"),
                      longitude: float = Query(..., description="Longitude of the location")):
    maybe_raise_random_error()

    request_second_service_http_request()

    # Check Redis for weather data
    redisData = get_data_from_redis(latitude, longitude)
    if redisData is not None:
        # Return data from Redis if it exists
        return redisData

    # Fetch data from Open-Meteo
    data = fetch_data_from_open_meteo(latitude, longitude)

    # Store data in Redis
    store_data_in_redis(latitude, longitude, data)

    return data
Part 5 - Custom metrics #
At last, let’s add a custom metrics that we can report from our application!
Add this here at the top of our main service file:
from opentelemetry import metrics
from opentelemetry.sdk.metrics import MeterProvider
from opentelemetry.sdk.metrics.export import (
    ConsoleMetricExporter,
    PeriodicExportingMetricReader,
)

metric_reader = PeriodicExportingMetricReader(ConsoleMetricExporter())
provider = MeterProvider(metric_readers=[metric_reader])

# Sets the global default meter provider
metrics.set_meter_provider(provider)

# Creates a meter from the global meter provider
meter = metrics.get_meter("my.meter.name")

exceptions_raised_counter = meter.create_counter(
    "exceptions.raised", unit="1", description="Counts the amount of exceptions raised"
)
Enhance our random error function, in case of an error, let us increase the exception_raised_counter by 1.
@tracer.start_as_current_span("maybe_raise_random_error")
def maybe_raise_random_error():
    if random.random() < 0.5:

        # The exception.type is optional and can be any kind of value you might be interested in
        exceptions_raised_counter.add(1, {"exception.type": HTTPException})

        logger.error('Random error occurred')
        # Return an error response 50% of the time
        raise HTTPException(status_code=500, detail='Random error occurred')
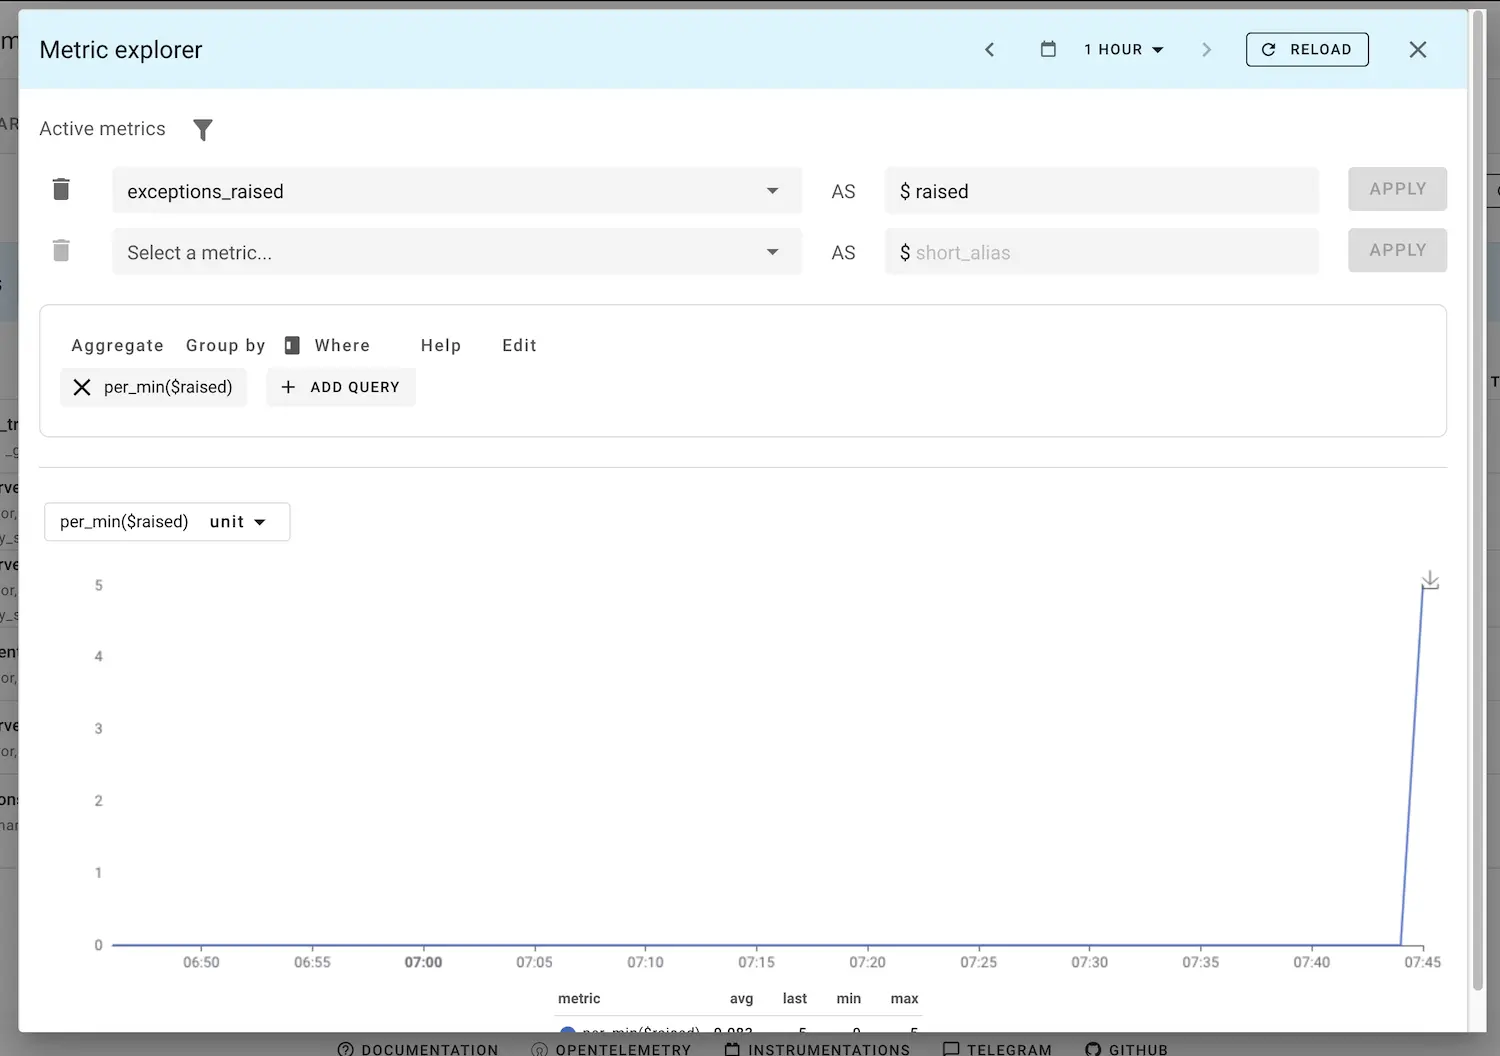
If we call our API endpoint now, we should see the metric appear in the Dashboards - Metrics overview.
Full code after part 5:
import requests
import logging
import redis

from fastapi import FastAPI, HTTPException, Query
from opentelemetry import trace
from opentelemetry.instrumentation.fastapi import FastAPIInstrumentor
from opentelemetry.instrumentation.requests import RequestsInstrumentor
from opentelemetry.sdk.trace import TracerProvider
import random


from opentelemetry import metrics
from opentelemetry.sdk.metrics import MeterProvider
from opentelemetry.sdk.metrics.export import (
    ConsoleMetricExporter,
    PeriodicExportingMetricReader,
)

metric_reader = PeriodicExportingMetricReader(ConsoleMetricExporter())
provider = MeterProvider(metric_readers=[metric_reader])

# Sets the global default meter provider
metrics.set_meter_provider(provider)

# Creates a meter from the global meter provider
meter = metrics.get_meter("my.meter.name")

exceptions_raised_counter = meter.create_counter(
    "exceptions.raised", unit="1", description="Counts the amount of exceptions raised"
)


# Create FastAPI app
app = FastAPI()

# Set up the TracerProvider
trace.set_tracer_provider(TracerProvider())

# Creates a tracer from the global tracer provider
tracer = trace.get_tracer("open-telemetry.part5")

# Setup the logger and set minimum log level to info, everything below will not be logged
logger = logging.getLogger(__name__)
logger.setLevel(logging.INFO)

# Instrument FastAPI and Requests
FastAPIInstrumentor.instrument_app(app)
RequestsInstrumentor().instrument()

# Connect to Redis
# Replace 'localhost' and '6379' with your Redis server's host and port if different
redis_client = redis.Redis(host='localhost', port=6379, db=0)

logger.info("hello from part 3")


def get_redis_key(latitude, longitude):
    # Create a unique key for the Redis entry
    return 'weather_data_' + str(latitude) + '_' + str(longitude)

@tracer.start_as_current_span("get_data_from_redis")
def get_data_from_redis(latitude, longitude):
    logger.info('Checking Redis for weather data')
    redisKey = get_redis_key(latitude, longitude)
    redisData = redis_client.get(redisKey)
    if redisData is not None:
        logger.info('Found weather data in Redis')
        return redisData

@tracer.start_as_current_span("store_data_in_redis")
def store_data_in_redis(latitude, longitude, data):
    logger.info('Storing weather data in Redis')
    redisKey = get_redis_key(latitude, longitude)
    # Store the data in Redis with a TTL of 4 seconds
    redis_client.set(redisKey, str(data), ex=4)


# Tracer annotation which will automatically create a span for this function
@tracer.start_as_current_span("fetch_data_from_open_meteo")
def fetch_data_from_open_meteo(latitude, longitude):
    # Alternative way of creating a span
    # with tracer.start_as_current_span("fetch_data_from_open_meteo") as span:

    logger.info('Fetching weather data from Open-Meteo')
    # Define the parameters for your request here
    params = {
        'latitude': latitude,  # Example latitude
        'longitude': longitude,  # Example longitude
        'hourly': 'temperature_2m'
    }

    # Make a GET request to the Open-Meteo API using requests
    response = requests.get('https://api.open-meteo.com/v1/forecast', params=params)

    logger.info('Received response from Open-Meteo %s', response)
    if response.status_code == 200:
        return response.json()
    else:
        # Handle errors
        raise HTTPException(status_code=500, detail='Failed to fetch data from Open-Meteo')

@tracer.start_as_current_span("maybe_raise_random_error")
def maybe_raise_random_error():
    if random.random() < 0.5:
        exceptions_raised_counter.add(1, {"exception.type": HTTPException})
        logger.error('Random error occurred')
        # Return an error response 50% of the time
        raise HTTPException(status_code=500, detail='Random error occurred')

@tracer.start_as_current_span("request_second_service_http_request")
def request_second_service_http_request():
    logger.info('Requesting second service')
    response = requests.get('http://localhost:8001/test')
    logger.info('Received response from second service %s', response)
    if response.status_code == 200:
        return response.json()
    else:
        # Handle errors
        raise HTTPException(status_code=500, detail='Failed to fetch data from second service')

# Endpoint for getting weather data, defined via annotation and using Query parameters
@app.get('/weather')
async def get_weather(latitude: float = Query(..., description="Latitude of the location"),
                      longitude: float = Query(..., description="Longitude of the location")):
    maybe_raise_random_error()

    request_second_service_http_request()

    # Check Redis for weather data
    redisData = get_data_from_redis(latitude, longitude)
    if redisData is not None:
        # Return data from Redis if it exists
        return redisData

    # Fetch data from Open-Meteo
    data = fetch_data_from_open_meteo(latitude, longitude)

    # Store data in Redis
    store_data_in_redis(latitude, longitude, data)

    return data
Common Challenges with OpenTelemetry #
At last, I like to give an overview of common challenges that one can experience with OpenTelemetry.
Complex setup #
From my experience, configuring a working setup is quite a learning curve and takes time to get right. There are many ways OpenTelemetry can be configured and you should take your time and patience.
Instrumentation Overhead #
You might be inclined to instrument everything you encounter, have every function and detail be reported to the APM of your choice. This can lead to performance overhead. It might slow down your application.
Data Volume Management #
Handling the sheer volume of telemetry data (logs, metrics, traces) can be challenging. This includes efficiently processing, storing, and analyzing the data without overwhelming the systems or incurring high costs.
Understanding and Utilizing Data #
Simply collecting a ton of data is just getting you half the way. The key here is reading the data correct, acting upon it and maybe setting up alarms to get a head start on surprises.
Troubleshooting and Debugging #
Diagnosing issues within the OpenTelemetry setup itself, such as missing data or incorrect traces, can be tricky and often requires a deep understanding of both OpenTelemetry and the application being monitored.
Conclusion #
As we wrap up our exploration in “Mastering OpenTelemetry with Uptrace: A Developer’s Guide,” we’ve unlocked the essentials of observability and application performance enhancement. The journey doesn’t stop here; it’s just the beginning of a deeper dive into the world of modern software monitoring.
Take Action and Stay Connected:
-
Engage with the Tools: Implement OpenTelemetry and Uptrace in your projects. Experience the transformative power of comprehensive observability.
-
Connect with Me: Follow me on Twitter or Mastodon for regular updates, thoughts, and discussions on software development and technology trends. Your engagement and feedback fuel the conversation and drive innovation. The realm of software development is ever-evolving, and staying informed and connected is key to mastering new challenges. By subscribing and following, you ensure you’re always equipped with the latest knowledge and community insights.
Your Next Step
Don’t just read about it—be part of the change. Start by integrating OpenTelemetry and Uptrace into your work, and join the broader conversation on Twitter or Mastodon. Your journey towards building more resilient, efficient, and transparent applications is well underway.